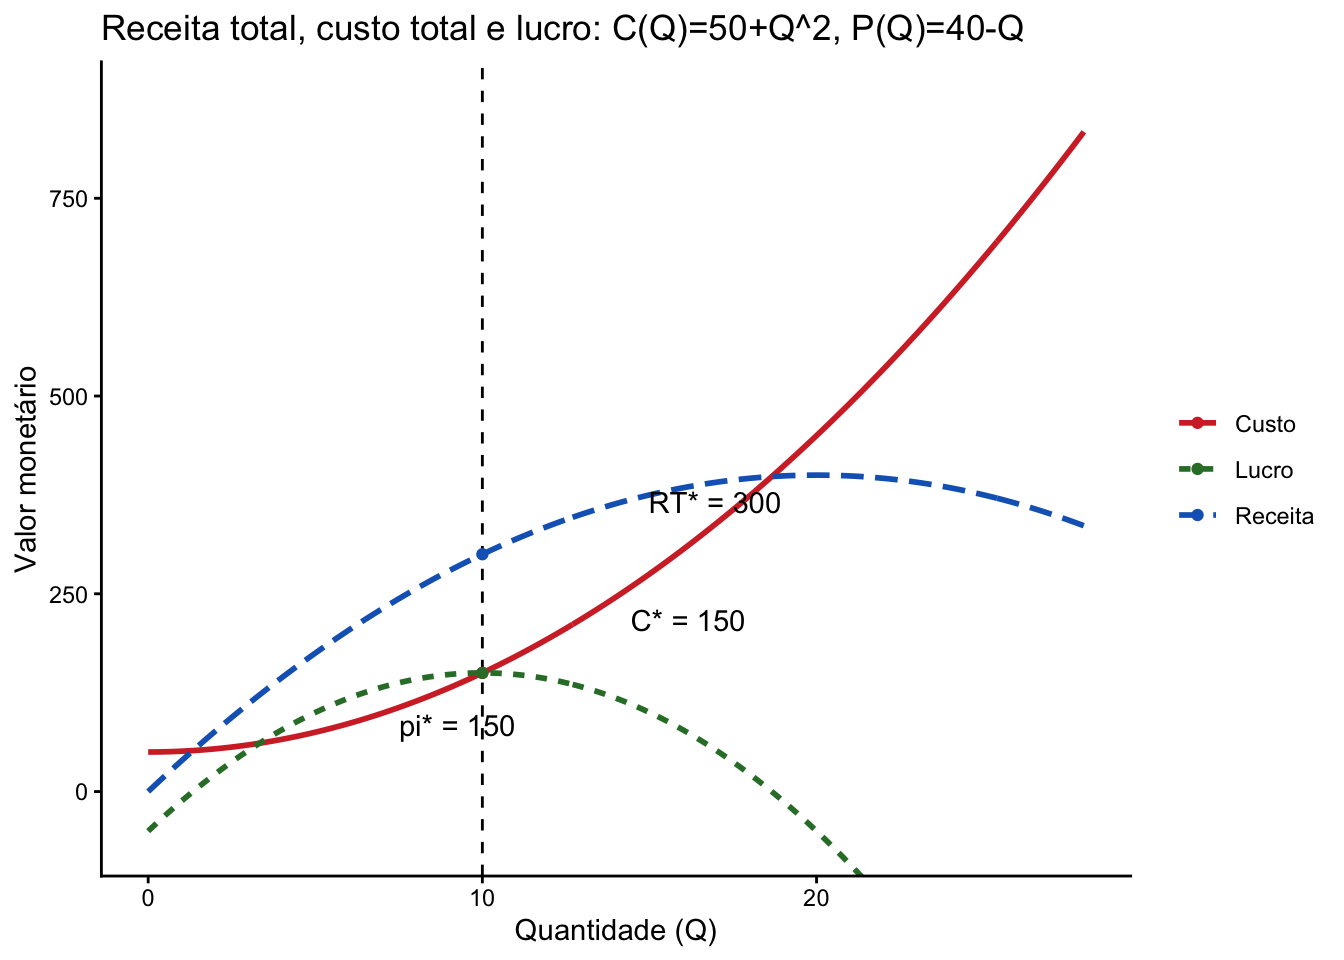
# Intervalo: de 0 até a interseção com P=0 (Q=40), com folga
Q_max <- 28

tibble(Q = seq(0, Q_max, by = 0.1)) |>
  mutate(
    Receita = RT(Q),
    Custo   = C(Q),
    Lucro   = PI(Q)
  ) |>
  pivot_longer(
    cols = c(Receita, Custo, Lucro),
    names_to = "curva",
    values_to = "valor") ->
  df

ggplot(df, aes(x = Q, y = valor, linetype = curva, color = curva)) +
  geom_line(linewidth = 1) +
  # marca o ótimo
  geom_vline(xintercept = Q_star, linetype = "dashed") +
  geom_point(
    data = tibble(Q = Q_star,
                  valor = c(RT_star, C_star, PI_star),
                  curva = c("Receita", "Custo", "Lucro")),
    aes(x = Q, y = valor, color = curva),  # <- herda as mesmas cores
    inherit.aes = FALSE
  ) +
  # anotações
  # annotate("text", x = Q_star,     y = -55,    label = glue("Q* = {Q_star}"), vjust = -2) +
  annotate("text", x = Q_star + 1, y = PI_star, label = as.character(glue("pi* = {PI_star}")), vjust = 3, hjust = 1) +
  annotate("text", x = Q_star + 1, y = RT_star, label = as.character(glue("RT* = {RT_star}")), vjust = -2, hjust = -1) +
  annotate("text", x = Q_star + 1, y = C_star,  label = as.character(glue("C* = {C_star}")), vjust = -2, hjust = -1) +
  # Cores pedidas
  scale_color_manual(values = c(
    "Custo"   = "#D32F2F",  # vermelho
    "Receita" = "#1565C0",  # azul
    "Lucro"   = "#2E7D32"   # verde
  )) +
  labs(x = "Quantidade (Q)", y = "Valor monetário",
       title = "Receita total, custo total e lucro: C(Q)=50+Q^2, P(Q)=40-Q",
       linetype = NULL, color = NULL) +
  coord_cartesian(xlim = c(0, Q_max), ylim = c(-60, max(df$valor)*1.05)) +
  theme_classic()