O oligopólio é a estrutura de mercado com poucas firmas que interagem estrategicamente: a decisão de cada firma (sobre quantidade ou preço) depende do que ela espera que as rivais farão. Situa-se entre concorrência perfeita (muitas firmas, ninguém com poder de mercado) e monopólio (uma única firma com poder máximo). É a forma de mercado mais comum na prática: indústria automobilística, companhias aéreas, telefonia, refrigerantes, supermercados.
A pergunta central é: dadas poucas firmas, qual o resultado de equilíbrio? A resposta depende de duas dimensões: (1) o que as firmas escolhem (quantidade ou preço); (2) quando escolhem (simultaneamente ou sequencialmente). Esses dois eixos geram quatro modelos canônicos:
Simultâneo
Sequencial
Quantidade
Cournot
Stackelberg
Preço
Bertrand
(raro na prática)
Mais cooperação explícita: cartel. Cada modelo dá um resultado diferente para os mesmos dados de mercado.
Os exemplos numéricos usam um mercado-fio-condutor: \(P(Q) = 339 - Q\) e \(CMg = CMe = 147\), onde \(Q = q_A + q_U\) é a soma das quantidades das duas firmas (American e United numa rota New York–Chicago). Os 4 modelos serão aplicados ao mesmo mercado para comparação direta dos resultados.
Note 11.1: Teoria dos jogos: estratégias dominantes e equilíbrio de Nash
Símbolo
Significado
jogadores, ações, payoffs
três ingredientes de um jogo
estratégia dominante
melhor escolha independentemente do que o oponente faz
equilíbrio de Nash
nenhum jogador quer mudar dadas as escolhas dos outros
jogos repetidos
sustentação de cooperação via ameaça crível
Desenvolvimento Teórico
Quatro ingredientes. Para representar matematicamente uma situação estratégica:
Lista de jogadores (\(n \geq 2\)).
Conjunto de ações disponíveis para cada um.
Payoffs (utilidade ou lucro) em cada combinação de ações.
Informação e tempo (jogo simultâneo ou sequencial).
Estratégia dominante. Ação que rende payoff melhor (ou pelo menos igual) que qualquer alternativa, qualquer que seja a escolha do oponente. Se ambos os jogadores têm estratégia dominante, o resultado é equilíbrio de estratégia dominante.
Equilíbrio de Nash. Conceito mais geral: perfil de estratégias em que nenhum jogador, observando a escolha do outro, prefere mudar a sua. Todo equilíbrio de estratégia dominante é Nash, mas a recíproca não vale (Nash existe sem dominância).
Jogos repetidos. Em jogos de um único período, a defecção é frequentemente Nash mesmo quando coletivamente subótima. Em jogos repetidos com horizonte longo (ou infinito), ameaças críveis sobre o futuro (“se você desviar, eu retalio para sempre”) podem sustentar a cooperação. Em jogos com horizonte conhecido e finito, indução retroativa quebra a cooperação a partir do último período.
Exercício Resolvido (Dilema do Prisioneiro)
Enunciado. A polícia detém dois suspeitos de um assalto cometido em conjunto. Há provas para condenar ambos por um delito menor (porte ilegal de arma), mas não pelo assalto. Os suspeitos ficam em celas separadas, sem comunicação. O promotor faz a mesma oferta a cada um:
Se você delatar o comparsa e ele ficar em silêncio, você sai livre (0 anos) e ele cumpre a pena cheia do assalto (5 anos).
Se ambos delatarem, os dois são condenados pelo assalto, com pena reduzida pela colaboração (3 anos cada).
Se ambos ficarem em silêncio, o promotor só obtém a condenação pelo delito menor (1 ano cada).
Payoffs em anos de prisão (menor é melhor):
Prisioneiro A \ Prisioneiro B
Silêncio
Delatar
Silêncio
(1, 1)
(5, 0)
Delatar
(0, 5)
(3, 3)
Cada par \((\pi_A, \pi_B)\): primeiro número é o payoff de A (linha), segundo é o de B (coluna). Os jogadores decidem simultaneamente, sem observar a escolha do outro.
Passo 1: melhor resposta e estratégia dominante de A
A melhor resposta de A a uma ação de B é a ação que minimiza os anos de prisão de A, dada aquela ação de B. Fixando cada ação possível de B:
Ação de B
A em silêncio
A delata
Melhor resposta de A
Silêncio
1
0
Delatar
Delatar
5
3
Delatar
Em ambas as linhas, delatar dá menos anos de prisão. Delatar é melhor resposta qualquer que seja a escolha de B, logo é estratégia estritamente dominante de A.
Passo 2: estratégia dominante de B
O jogo é simétrico (a matriz se repete trocando linhas por colunas). Aplicando o mesmo argumento às linhas, delatar também é estratégia estritamente dominante de B.
Passo 3: equilíbrio de estratégia dominante
Como os dois jogadores têm estratégia dominante, o resultado não depende de crenças sobre o oponente:
\[\boxed{(\text{Delatar}, \text{Delatar}) \text{ com payoff } (3, 3)}\]
É também equilíbrio de Nash: dado que B delata, a melhor resposta de A é delatar (3 anos contra 5 do silêncio), e vice-versa. Nenhum jogador melhora desviando unilateralmente.
Passo 4: a tensão do dilema
O perfil \((\text{Silêncio}, \text{Silêncio}) = (1, 1)\) é Pareto-superior ao equilíbrio \((3, 3)\): ambos ficariam estritamente melhor. Ainda assim ele não se sustenta. Partindo de \((\text{Silêncio}, \text{Silêncio})\), cada jogador tem incentivo a desviar para delatar e cair de 1 para 0 ano. Chegar ao resultado eficiente exigiria coordenação (combinar a ação) e compromisso (um mecanismo que torne crível a promessa de silêncio). Sem isso, a busca racional do interesse individual conduz os dois ao pior resultado mútuo: racionalidade individual não garante eficiência coletiva.
Ponte com o oligopólio. Troque “prisioneiros” por “firmas” e “silêncio/delatar” por “cooperar/competir agressivamente”: cortar preço, expandir a quantidade ou anunciar são as “delações” do oligopólio. Cada firma tem incentivo individual a desviar do resultado cooperativo, e o equilíbrio acaba pior para todas. O exemplo Coke × Pepsi a seguir é exatamente esse jogo, com payoffs medidos em lucro no lugar de anos de prisão.
Enunciado. Coca-Cola e Pepsi disputam um mercado de refrigerantes que vale US$ 16 bilhões em vendas. Cada empresa decide, simultaneamente, se faz ou não uma campanha de propaganda nacional. A campanha custa US$ 5 bilhões e seu efeito sobre as vendas é:
Se nenhuma anuncia, o mercado se divide ao meio: US$ 8 bilhões de lucro para cada uma, sem custo de propaganda.
Se só uma anuncia, ela captura todo o mercado: US$ 16 bilhões em vendas menos os US$ 5 bilhões da campanha, lucro de US$ 11 bilhões. A rival, sem propaganda, fica sem vendas (US$ 0).
Se as duas anunciam, as campanhas se neutralizam e o mercado volta a se dividir ao meio, mas agora cada uma arca com os US$ 5 bilhões da campanha: lucro de US$ 3 bilhões para cada.
Payoffs em bilhões de dólares de lucro (maior é melhor):
Coke \ Pepsi
Não anunciar
Anunciar
Não anunciar
(8, 8)
(0, 11)
Anunciar
(11, 0)
(3, 3)
Passo 5: estratégia dominante
Se Pepsi não anuncia: Coke compara 8 (não anunciar) com 11 (anunciar). Como 11 > 8, Coke prefere anunciar.
Se Pepsi anuncia: Coke compara 0 com 3. Coke prefere anunciar.
Anunciar é dominante para Coke (e por simetria para Pepsi).
Passo 6: Nash
\[\boxed{(\text{Anunciar}, \text{Anunciar}) \text{ com payoff } (3, 3)}\]
Pareto-pior que (Não anunciar, Não anunciar) = (8, 8). Mesma estrutura do Dilema do Prisioneiro aplicada ao oligopólio: cada firma gasta com propaganda; o efeito agregado é se anular mutuamente; ambas teriam ganho mais não anunciando.
Exercício Resolvido (jogos repetidos)
Enunciado. O jogo Coke × Pepsi do exercício anterior agora se repete ano após ano. As duas firmas começam num acordo tácito: nenhuma anuncia e cada uma lucra US$ 8 bilhões por ano. A Coke adota uma estratégia de gatilho: não anuncia enquanto a Pepsi não anunciar, mas se a Pepsi anunciar uma única vez, passa a anunciar para sempre. A Pepsi avalia se compensa romper o acordo, anunciando já no período 1. Cada US$ 1 recebido no período seguinte vale \(\delta \in (0, 1)\) hoje (o fator de desconto: \(\delta\) alto significa que o futuro pesa muito na decisão).
Passo 7: caminho do desvio
Se a Pepsi anuncia no período 1, a Coke ainda está cooperando naquele período, porque a punição só começa depois de observar o desvio. A Pepsi anuncia sozinha e captura US$ 11 bilhões. Do período 2 em diante a Coke retalia e anuncia para sempre; a melhor resposta da Pepsi é também anunciar, e as duas ficam presas no equilíbrio \((3, 3)\).
Para somar lucros de períodos diferentes é preciso trazê-los todos para o presente. R$ 1 recebido daqui a um período vale \(\delta\) hoje; dois períodos à frente, \(\delta^2\); três períodos, \(\delta^3\); e assim por diante. O período 1 é “agora” e conta inteiro (\(\delta^0 = 1\)). O lucro descontado da Pepsi no caminho do desvio, período a período:
Período
Lucro da Pepsi
Trazido para hoje
1
11
\(11\)
2
3
\(3\delta\)
3
3
\(3\delta^2\)
4
3
\(3\delta^3\)
…
3
…
\[\pi^{\text{Pepsi}}_{\text{desvio}} = \underbrace{11}_{\text{período 1}} + \underbrace{3\delta + 3\delta^2 + 3\delta^3 + \ldots}_{\text{retaliação, do período 2 em diante}}\]
A cauda da retaliação é uma série geométrica: cada termo é o anterior multiplicado por \(\delta\). Para \(0 < \delta < 1\), vale a forma fechada \(a + a\delta + a\delta^2 + \ldots = \dfrac{a}{1 - \delta}\), em que \(a\) é o primeiro termo. Aqui \(a = 3\delta\), então a cauda soma \(\dfrac{3\delta}{1 - \delta}\):
Se a Pepsi nunca anuncia, o gatilho da Coke nunca dispara e as duas seguem em \((8, 8)\) indefinidamente. Aplicando o mesmo desconto período a período, o lucro é a série geométrica com primeiro termo \(a = 8\) e razão \(\delta\):
Para enxergar a intuição, ignore o desconto (\(\delta = 1\)) e some os lucros período a período. O desvio adianta um ganho alto no período 1, mas condena a Pepsi a US$ 3 bilhões depois; a cooperação rende US$ 8 bilhões sempre:
Períodos somados
Lucro acumulado do desvio
Lucro acumulado da cooperação
Vencedor
1
11
8
desvio
2
14
16
cooperação
3
17
24
cooperação
\(n\) grande
\(11 + 3(n - 1)\)
\(8n\)
cooperação
O desvio só compensa se a Pepsi der pouquíssimo valor ao futuro. A partir de dois períodos a cooperação domina, e a vantagem cresce US$ 5 bilhões por período adicional (8 contra 3).
Passo 10: condição com fator de desconto
Com horizonte infinito, a comparação correta usa as somas descontadas dos Passos 7 e 8. A cooperação se sustenta quando \(\pi^{\text{Pepsi}}_{\text{coop}} \geq \pi^{\text{Pepsi}}_{\text{desvio}}\):
\[\boxed{\delta \geq 0{,}375 \implies \text{cooperação é sustentável}}\]
Se a Pepsi valoriza o futuro o suficiente (\(\delta \geq 0,375\)), a ameaça de retaliação da Coke torna o desvio não compensador e o acordo tácito se mantém sem nenhum contrato formal. Se o futuro vale pouco (\(\delta < 0,375\)), o ganho imediato de anunciar supera a punição descontada e o acordo desmorona.
Para horizonte finito conhecido, vale a indução retroativa: no último período não há punição futura, então desvia-se; antecipando isso, desvia-se no penúltimo; e assim por diante até o período 1. A cooperação só se sustenta quando o jogo não tem fim previsível.
Interpretação
Por que cartéis e cooperação às vezes se sustentam, às vezes não. Empresas com relação duradoura (mesmo setor, mesma feira anual, regulador comum) jogam o jogo repetido. Cooperação tácita pode emergir sem acordo formal — ninguém precisa de contrato escrito para “saber” que retaliações virão. Empresas em situações pontuais (uma única licitação, projeto único, fim iminente do mercado) jogam o jogo finito: indução retroativa quebra qualquer cooperação.
Disciplina pela ameaça. O que sustenta a cooperação não é benevolência — é o cálculo individual de cada jogador antecipando a retaliação futura. A teoria dos jogos foca incentivos sobre resultados: se os incentivos individuais favorecem a defecção, ela ocorre, independentemente do que seria “melhor” coletivamente.
Aplicação real
Marcas de destilados nos EUA. Por anos, marcas como Jim Beam, Jack Daniels e Maker’s Mark evitavam anúncios na TV. Não era proibição legal; era um acordo tácito sustentado pela ameaça de retaliação publicitária mútua. Uma vez que o acordo colapsou (uma marca testou e ninguém respondeu), todas começaram a anunciar — exatamente o equilíbrio de Nash competitivo.
BA × Virgin (sobretaxas de combustível). Caso detalhado em Note 11.5. As duas companhias dominantes nas rotas transatlânticas combinaram elevar coordenadamente as sobretaxas de US$ 10 para US$ 120. Funcionou por um tempo. Quando a Virgin percebeu que era um jogo finito (alguém eventualmente trairia ou seria descoberto), aplicou indução reversa: denunciou primeiro ao regulador. Recebeu punição leve; BA pagou multa de US$ 500 mi.
demanda residual (parte do mercado não atendida pela rival)
\(q_A^*(q_U)\)
função de melhor resposta da firma A
equilíbrio de Cournot-Nash
par \((q_A^*, q_U^*)\) na interseção das duas melhores respostas
Desenvolvimento Teórico
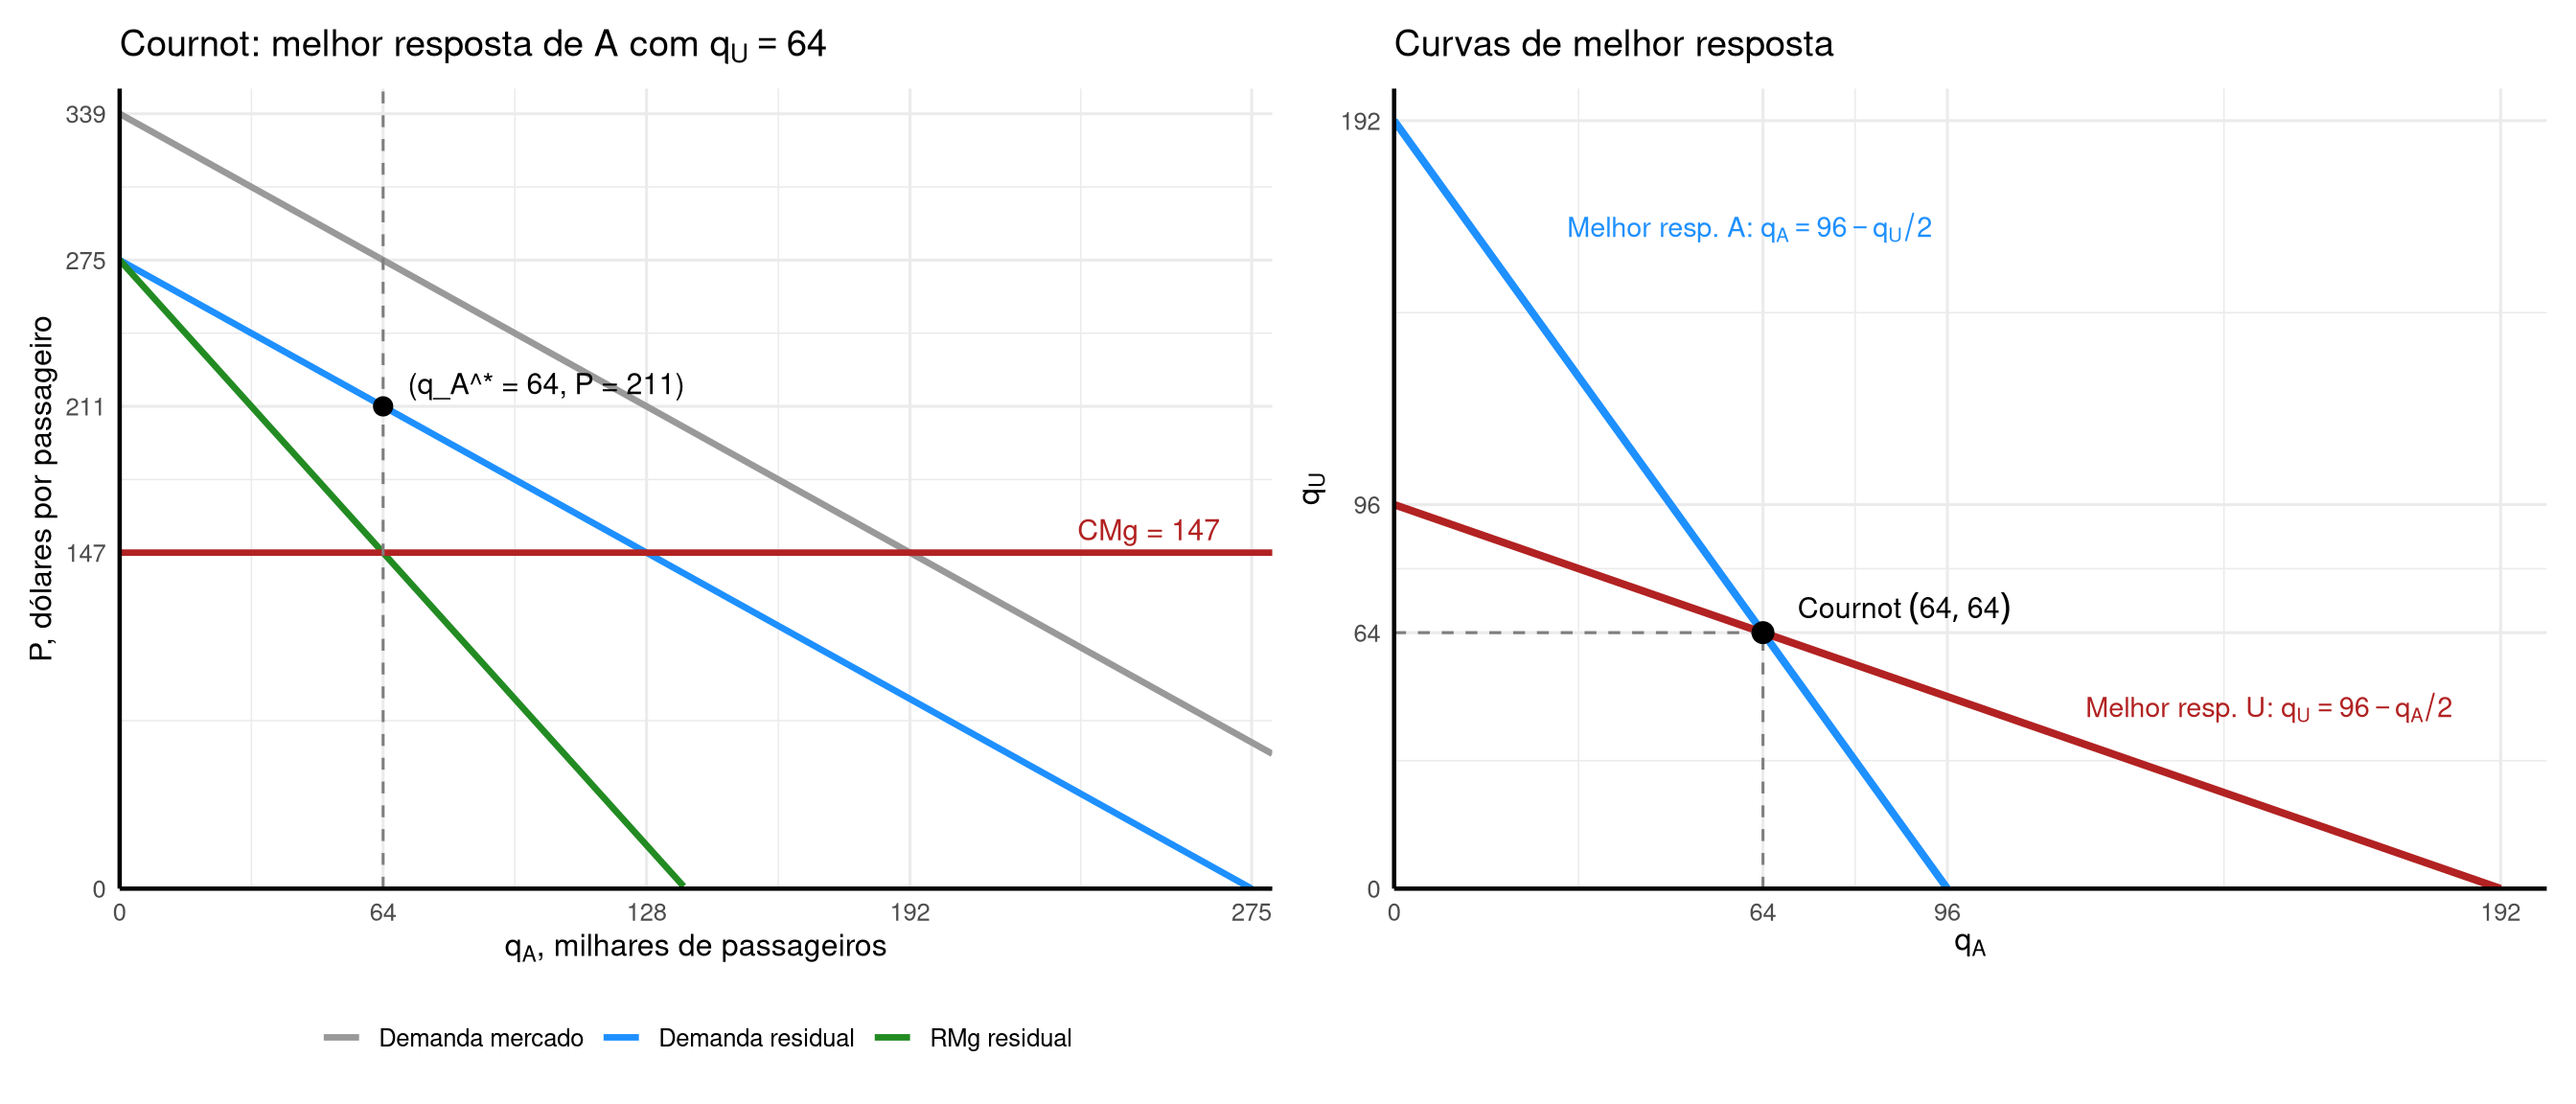
O modelo. Duas firmas escolhem simultaneamente suas quantidades, sem conhecer a escolha da rival. Cada uma trata a quantidade da outra como dada (uma “estimativa”) e maximiza seu próprio lucro nessa condição. O equilíbrio é o par de quantidades em que ambas estão simultaneamente em suas melhores respostas — nenhuma se arrepende ao observar a escolha da outra.
Demanda residual. Se a firma A espera que U produza \(q_U\), então dos \(339 - P\) potenciais consumidores ao preço \(P\), \(q_U\) já estão atendidos pela rival. A demanda que resta para A é a demanda de mercado deslocada para a esquerda:
\[P = (339 - q_U) - q_A\]
A receita total de A sobre essa demanda residual é \(RT_A^r = [(339 - q_U) - q_A] \cdot q_A\), e a receita marginal residual:
\[RMg_A^r = (339 - q_U) - 2 q_A\]
Note o “dobro da inclinação” característico do caso linear: \(RMg^r\) tem inclinação \(-2\) enquanto a demanda residual tem inclinação \(-1\).
Maximização. A firma A resolve um problema idêntico ao do monopolista sobre sua demanda residual:
Quanto mais a rival produz, menor a melhor resposta — a inclinação \(-1/2\) quantifica essa substituição estratégica.
Equilíbrio. Por simetria (firmas com mesma estrutura de custos), \(q_U^* = 96 - q_A/2\). O equilíbrio de Cournot-Nash é a interseção das duas curvas de melhor resposta. Como ambas têm a mesma forma e o problema é simétrico, \(q_A^* = q_U^*\).
cor1 <-"dodgerblue"cor2 <-"firebrick"cor3 <-"forestgreen"cor4 <-"darkorange"# Painel 1: demanda residual + RMg^r + CMg para q_U = 64mc <-147q_U_assumido <-64P_d <-function(Q) 339- QP_dr <-function(qA) (339- q_U_assumido) - qARMg_r <-function(qA) (339- q_U_assumido) -2* qAq_A_eq <- (192- q_U_assumido) /2P_eq_resid <-P_dr(q_A_eq)q_seq <-seq(0, 280, by =1)df1 <-tibble(q = q_seq,Demanda =P_d(q),Demanda_r =P_dr(q),RMg_r =RMg_r(q))g1 <-ggplot() +geom_line(data = df1[df1$Demanda >=0, ],aes(x = q, y = Demanda, color ="Demanda mercado"),linewidth =1.2) +geom_line(data = df1[df1$Demanda_r >=0, ],aes(x = q, y = Demanda_r, color ="Demanda residual"),linewidth =1.2) +geom_line(data = df1[df1$RMg_r >=0, ],aes(x = q, y = RMg_r, color ="RMg residual"),linewidth =1.2) +geom_hline(yintercept = mc, color = cor2, linewidth =1.2) +geom_vline(xintercept = q_A_eq, linetype ="dashed", color ="gray50") +annotate("point", x = q_A_eq, y = P_eq_resid,color ="black", size =3) +annotate("text", x = q_A_eq +6, y = P_eq_resid +10,label =TeX(r"((q_A^* = 64, P = 211))"),hjust =0, size =4) +annotate("text", x =250, y = mc +10, label ="CMg = 147",color = cor2, size =4) +scale_color_manual(values =c(`Demanda mercado`="gray60",`Demanda residual`= cor1,`RMg residual`= cor3)) +scale_x_continuous(limits =c(0, 280), expand =c(0, 0),breaks =c(0, q_A_eq, 128, 192, 275),labels =c("0", "64", "128", "192", "275")) +scale_y_continuous(limits =c(0, 350), expand =c(0, 0),breaks =c(0, 147, 211, 275, 339),labels =c("0", "147", "211", "275", "339")) +labs(title =TeX(r"(Cournot: melhor resposta de A com $q_U = 64$)"),x =TeX(r"($q_A$, milhares de passageiros)"),y ="P, dólares por passageiro",color =NULL) +theme_minimal(base_size =12) +theme(axis.line =element_line(color ="black", linewidth =0.8),legend.position ="bottom" )# Painel 2: curvas de melhor resposta no plano (q_A, q_U)br_A <-function(qU) 96-0.5* qUbr_U <-function(qA) 96-0.5* qAg2 <-ggplot() +# br_A (melhor resposta de A): q_A = 96 - q_U/2, line de (0,192) a (96,0)annotate("segment", x =0, xend =96, y =192, yend =0,color = cor1, linewidth =1.4) +# br_U (melhor resposta de U): q_U = 96 - q_A/2, line de (0,96) a (192,0)annotate("segment", x =0, xend =192, y =96, yend =0,color = cor2, linewidth =1.4) +annotate("segment", x =0, xend =64, y =64, yend =64,linetype ="dashed", color ="gray50") +annotate("segment", x =64, xend =64, y =0, yend =64,linetype ="dashed", color ="gray50") +annotate("point", x =64, y =64, color ="black", size =3.5) +annotate("text", x =70, y =70,label =TeX(r"(Cournot $(64, 64)$)"), hjust =0, size =4) +annotate("text", x =30, y =165,label =TeX(r"(Melhor resp. A: $q_A = 96 - q_U/2$)"),color = cor1, size =3.8, hjust =0) +annotate("text", x =120, y =45,label =TeX(r"(Melhor resp. U: $q_U = 96 - q_A/2$)"),color = cor2, size =3.8, hjust =0) +scale_x_continuous(limits =c(0, 200), expand =c(0, 0),breaks =c(0, 64, 96, 192),labels =c("0", "64", "96", "192")) +scale_y_continuous(limits =c(0, 200), expand =c(0, 0),breaks =c(0, 64, 96, 192),labels =c("0", "64", "96", "192")) +labs(title ="Curvas de melhor resposta",x =TeX(r"($q_A$)"), y =TeX(r"($q_U$)")) +theme_minimal(base_size =12) +theme(axis.line =element_line(color ="black", linewidth =0.8) )g1 + g2
Interpretação
Substitutos estratégicos. A curva de melhor resposta tem inclinação negativa: mais produção da rival → menor produção ótima minha. As variáveis de escolha (quantidades) “se movem em direções opostas”. Esse padrão caracteriza a competição em quantidades. Em Bertrand (próximo callout), a relação se inverte: preços são complementos estratégicos.
Por que Cournot fica entre monopólio e CP. Cada firma absorve o efeito-preço de sua própria expansão, mas internaliza apenas parcialmente o efeito sobre a rival. Quando A produz mais, o preço cai para todos, mas A não compensa U pela queda de receita de U — daí o incentivo a expandir além do nível que maximizaria o lucro conjunto. O resultado: \(Q_C = 128 > Q_M = 96\) (mais que monopólio) mas \(Q_C < Q_{PC} = 192\) (menos que competitivo).
Generalização para \(n\) firmas. Em duopólio simétrico, cada firma produz \(\frac{a - CMg}{(n+1)b}\) onde \(a\) é o intercepto da demanda e \(b\) é a inclinação. Aqui \(\frac{339 - 147}{3 \cdot 1} = 64\). Para \(n\) firmas, a fórmula vira \(q_i = \frac{a - CMg}{(n+1)b}\), e \(Q_n = \frac{n(a-CMg)}{(n+1)b}\). Como \(n \to \infty\), \(Q_n \to \frac{a-CMg}{b} = Q_{PC}\) — Cournot converge para CP (Note 11.6).
Aplicação real
Indústria automobilística. Construir uma fábrica de carros leva 2-3 anos. Decisões de capacidade são lentas e irreversíveis. Quando demanda muda no curto prazo, montadoras ajustam principalmente preços de modelos existentes — mas a capacidade de longo prazo é o que importa, e ela é decidida via Cournot (cada firma escolhe quantos carros vai produzir nos próximos anos antecipando o que rivais vão produzir).
OPEP. Cartel internacional onde cada país-membro tem sua cota de produção. A negociação periódica é sobre quantidades (não preços diretamente). Tecnicamente, OPEP aproxima-se de cartel, mas defecções e incumprimento de cotas são frequentes — quando isso ocorre, o equilíbrio se aproxima de Cournot.
Note 11.3: Stackelberg: vantagem do líder via indução reversa
Símbolo
Significado
líder
firma que escolhe quantidade primeiro
seguidor
firma que observa e responde
indução reversa
resolução do jogo do final para o início
comprometimento crível
capacidade do líder de “amarrar” sua escolha
Desenvolvimento Teórico
Diferença em relação a Cournot. Mesma escolha (quantidade), mesma demanda, mesmos custos. Muda só o tempo: a decisão é sequencial. O líder escolhe \(q_A\) primeiro; o seguidor observa \(q_A\) e só então escolhe \(q_U\). Essa ordem, e nada mais, gera todo o resultado.
O líder não trata \(q_U\) como dado. É o que separa Stackelberg de Cournot. Em Cournot as firmas decidem ao mesmo tempo: cada uma toma a quantidade da rival como um número fixo e responde a ele (equilíbrio de Nash simultâneo). Em Stackelberg o líder sabe que o seguidor vai reagir à escolha dele. Para o líder, \(q_U\) não é um número: é uma função de \(q_A\).
Indução reversa. O jogo tem dois estágios e resolve-se de trás para frente.
Estágio 2 (seguidor). Dado qualquer \(q_A\) observado, o seguidor maximiza o próprio lucro. O resultado é a função de melhor resposta \(q_U^*(q_A)\), a mesma de Note 11.2: o problema do seguidor é idêntico, tomar \(q_A\) como dado e responder.
Estágio 1 (líder). O líder antecipa o estágio 2. Substitui \(q_U^*(q_A)\) na própria função de lucro, obtendo um lucro que depende só de \(q_A\), e escolhe o \(q_A\) que o maximiza.
A substituição é o passo central: transforma um jogo de duas firmas num problema de otimização de uma variável só para o líder.
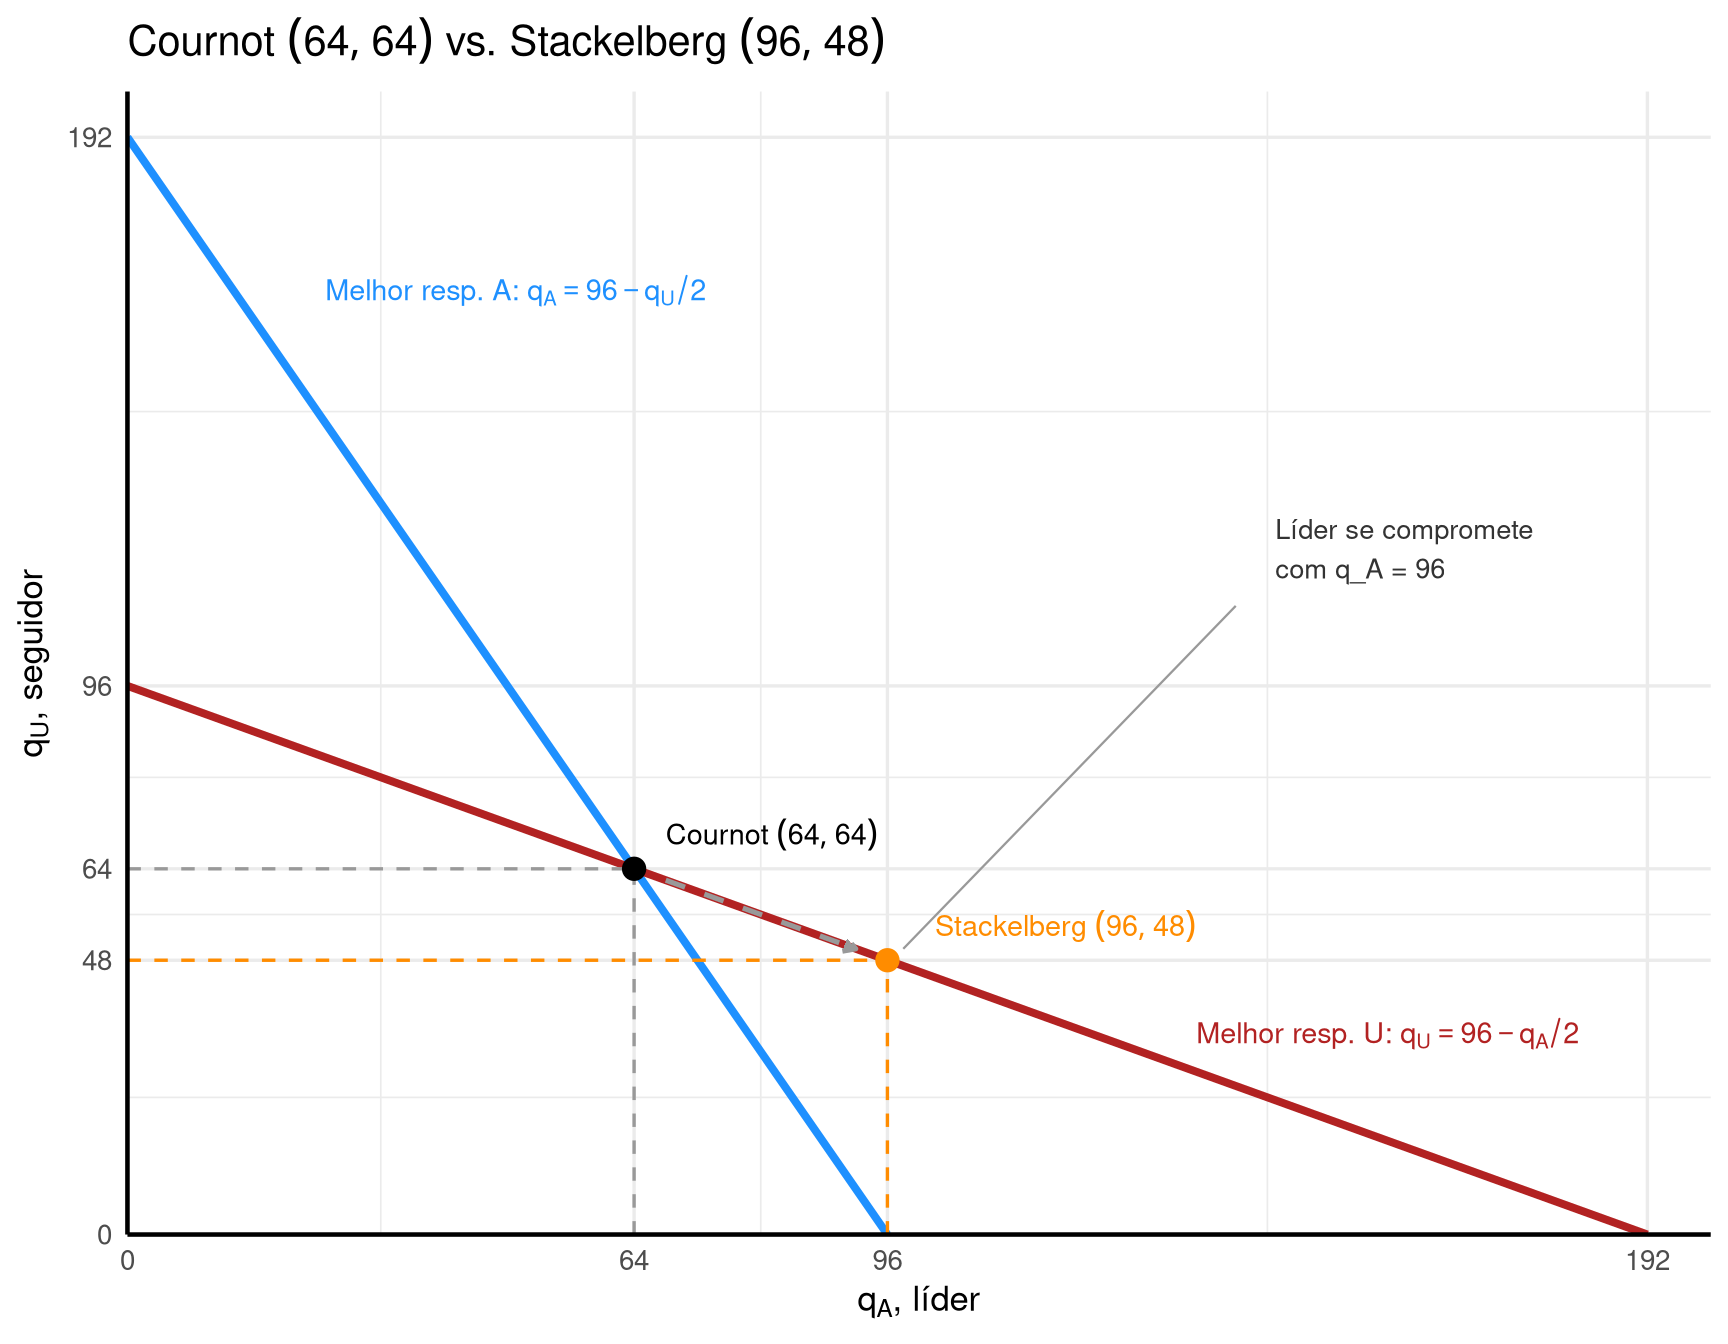
Mecanismo da vantagem do líder. Ao se comprometer com uma \(q_A\) alta, o líder reduz a demanda residual do seguidor (o que sobra do mercado depois da produção do líder). O seguidor, com menos espaço, recua e produz menos do que produziria em Cournot. O líder, sabendo disso de antemão, ocupa esse espaço: produz mais que em Cournot, o seguidor produz menos, e o líder lucra mais. A vantagem do primeiro movimento não vem de chegar antes, vem de fazer o rival reagir a uma escolha já consumada.
Comprometimento crível. A vantagem só existe se o líder não puder voltar atrás. Se, ao ver a resposta do seguidor, o líder pudesse reescolher \(q_A\), ele preferiria reduzir, e o seguidor, antecipando isso, não recuaria. A \(q_A\) alta só é equilíbrio se for irreversível e observável: capacidade já instalada, contrato de longo prazo com fornecedores, anúncio público com custo de reversão.
Exercício Resolvido
Mesmo mercado: \(P = 339 - q_A - q_U\), \(CMg = 147\). American é líder (A), United é seguidor (U).
A vantagem do líder é redistributiva, não criadora de valor — ela destrói lucro total mas concentra o que sobra em favor de quem move primeiro.
Implementação em R
Código
cor1 <-"dodgerblue"cor2 <-"firebrick"cor3 <-"forestgreen"cor4 <-"darkorange"# Curvas de melhor respostaggplot() +# br_A (melhor resposta de A): q_A = 96 - q_U/2, line de (0,192) a (96,0)annotate("segment", x =0, xend =96, y =192, yend =0,color = cor1, linewidth =1.4) +# br_U (melhor resposta de U): q_U = 96 - q_A/2, line de (0,96) a (192,0)annotate("segment", x =0, xend =192, y =96, yend =0,color = cor2, linewidth =1.4) +# Cournotannotate("segment", x =0, xend =64, y =64, yend =64,linetype ="dashed", color ="gray60") +annotate("segment", x =64, xend =64, y =0, yend =64,linetype ="dashed", color ="gray60") +annotate("point", x =64, y =64, color ="black", size =3.5) +annotate("text", x =64+4, y =64+6,label =TeX(r"(Cournot $(64, 64)$)"),hjust =0, size =3.8) +# Stackelbergannotate("segment", x =0, xend =96, y =48, yend =48,linetype ="dashed", color = cor4) +annotate("segment", x =96, xend =96, y =0, yend =48,linetype ="dashed", color = cor4) +annotate("point", x =96, y =48, color = cor4, size =3.5) +annotate("text", x =96+6, y =48+6,label =TeX(r"(Stackelberg $(96, 48)$)"),color = cor4, hjust =0, size =3.8) +# Seta indicando movimento Cournot -> Stackelberg sobre br_Uannotate("segment", x =68, xend =92, y =62, yend =50,arrow =arrow(length =unit(0.18, "cm"), type ="closed"),color ="gray60", linewidth =0.9, linetype ="dashed") +# Rótulo deslocado para área livre (canto superior direito);# linha conectora aponta para o ponto Stackelberg (96, 48)annotate("segment", x =140, xend =98, y =110, yend =50,color ="gray60", linewidth =0.4) +annotate("text", x =145, y =120,label ="Líder se compromete\ncom q_A = 96",color ="gray20", size =3.6, hjust =0) +annotate("text", x =25, y =165,label =TeX(r"(Melhor resp. A: $q_A = 96 - q_U/2$)"),color = cor1, size =3.8, hjust =0) +annotate("text", x =135, y =35,label =TeX(r"(Melhor resp. U: $q_U = 96 - q_A/2$)"),color = cor2, size =3.8, hjust =0) +scale_x_continuous(limits =c(0, 200), expand =c(0, 0),breaks =c(0, 64, 96, 192),labels =c("0", "64", "96", "192")) +scale_y_continuous(limits =c(0, 200), expand =c(0, 0),breaks =c(0, 48, 64, 96, 192),labels =c("0", "48", "64", "96", "192")) +labs(title =TeX(r"(Cournot $(64, 64)$ vs. Stackelberg $(96, 48)$)"),x =TeX(r"($q_A$, líder)"),y =TeX(r"($q_U$, seguidor)") ) +theme_minimal(base_size =13) +theme(axis.line =element_line(color ="black", linewidth =0.8) )
Interpretação
Por que o líder não fica na sua melhor resposta de Cournot. Ao escolher \(q_A = 96\), o líder está fora da sua curva de melhor resposta — produzir 96 dado \(q_U = 48\) não é a melhor resposta a 48 (a melhor resposta seria \(96 - 48/2 = 72\)). Mas o líder não está respondendo a \(q_U\); ele está escolhendo qual \(q_U\) induzir. Ao se comprometer com 96, ele coloca o seguidor numa posição em que 48 é ótimo. O seguidor, por sua vez, está na sua melhor resposta — só o líder se afasta.
Comprometimento é tudo. Se o líder pudesse desfazer sua decisão depois de ver o seguidor, ele preferiria voltar a Cournot. O equilíbrio Stackelberg só existe se o comprometimento for observável (rival sabe) e irreversível (rival sabe que não há retorno). Investimento em capacidade fixa, contratos de longo prazo com fornecedores, anúncios públicos com custo de reversão — tudo isso são tecnologias de comprometimento.
Stackelberg destrói lucro total. Comparado ao cartel (\(\pi\) total = 9 216) ou Cournot (\(\pi\) total = 8 192), Stackelberg gera menos lucro agregado. A “vantagem” do líder é puramente redistributiva: ele captura mais de um bolo menor. Por isso firmas frequentemente preferem não ser líderes se podem evitar — exceto quando o comprometimento já é fato consumado (capacidade já construída, marca já consolidada).
Aplicação real
Apple-Samsung (smartphones). Apple lança novo iPhone em data anunciada, com especificações públicas. Samsung observa as características do produto, antecipa a demanda residual e responde com seu próprio lançamento (Galaxy) algumas semanas depois. A Apple não tem como “voltar atrás” — o iPhone já está na assembly line.
Lançamentos de carros. Toyota lança um novo Corolla em fevereiro; Volkswagen, Hyundai e outras observam vendas iniciais e ajustam capacidade dos seus modelos correspondentes. O líder se beneficia da posição de primeira opção, mas paga o preço de não conseguir reagir aos lançamentos das rivais.
Não confundir com monopólio. O líder Stackelberg não é monopolista — ele divide o mercado com o seguidor. A diferença com Cournot é apenas a sequência da escolha. Em monopólio puro, não há rival no mercado.
redução marginal do preço para capturar todo o mercado
paradoxo de Bertrand
resultado competitivo com apenas 2 firmas
Desenvolvimento Teórico
O modelo. As firmas escolhem preços simultaneamente, não quantidades. Os consumidores compram da firma de menor preço; em caso de empate, o mercado se divide igualmente; a firma de preço mais alto vende zero. O bem é homogêneo: para o consumidor, o produto de A e o de U são idênticos, então só o preço decide a compra.
A função de lucro é descontínua. Aqui \(Q(P)\) é a demanda de mercado ao preço \(P\). A firma que cobra menos atende essa demanda inteira; a outra não vende nada:
O salto é o ponto central: baixar o preço um centavo abaixo do rival não aumenta a venda “um pouco”, faz a participação no mercado pular de 50% para 100%. Toda a lógica do modelo vem dessa descontinuidade.
Equilíbrio: por que só \(P = CMg\) sobrevive. Um equilíbrio de Nash exige que nenhuma firma queira mudar de preço sozinha. Testando os três casos possíveis:
\(P > CMg\) não é equilíbrio. Se as duas cobram o mesmo \(P > CMg\), cada uma ganha \((P - CMg)\,Q(P)/2\). Qualquer uma pode cobrar \(P - \epsilon\) (o undercutting), capturar o mercado inteiro e quase dobrar o lucro. Como sempre existe esse desvio lucrativo, nenhum preço acima do custo resiste.
\(P < CMg\) não é equilíbrio. Vender abaixo do custo marginal dá prejuízo em cada unidade. A firma prefere subir o preço a sustentar perda.
\(P = CMg\) é equilíbrio. Com as duas em \(P = CMg\), o lucro é zero. Baixar o preço gera prejuízo; subir entrega todo o mercado à rival e mantém o lucro em zero. Nenhum desvio melhora a situação de quem o faz.
Sobra um único equilíbrio: \(P_A^* = P_U^* = CMg\), com \(\pi_A^* = \pi_U^* = 0\).
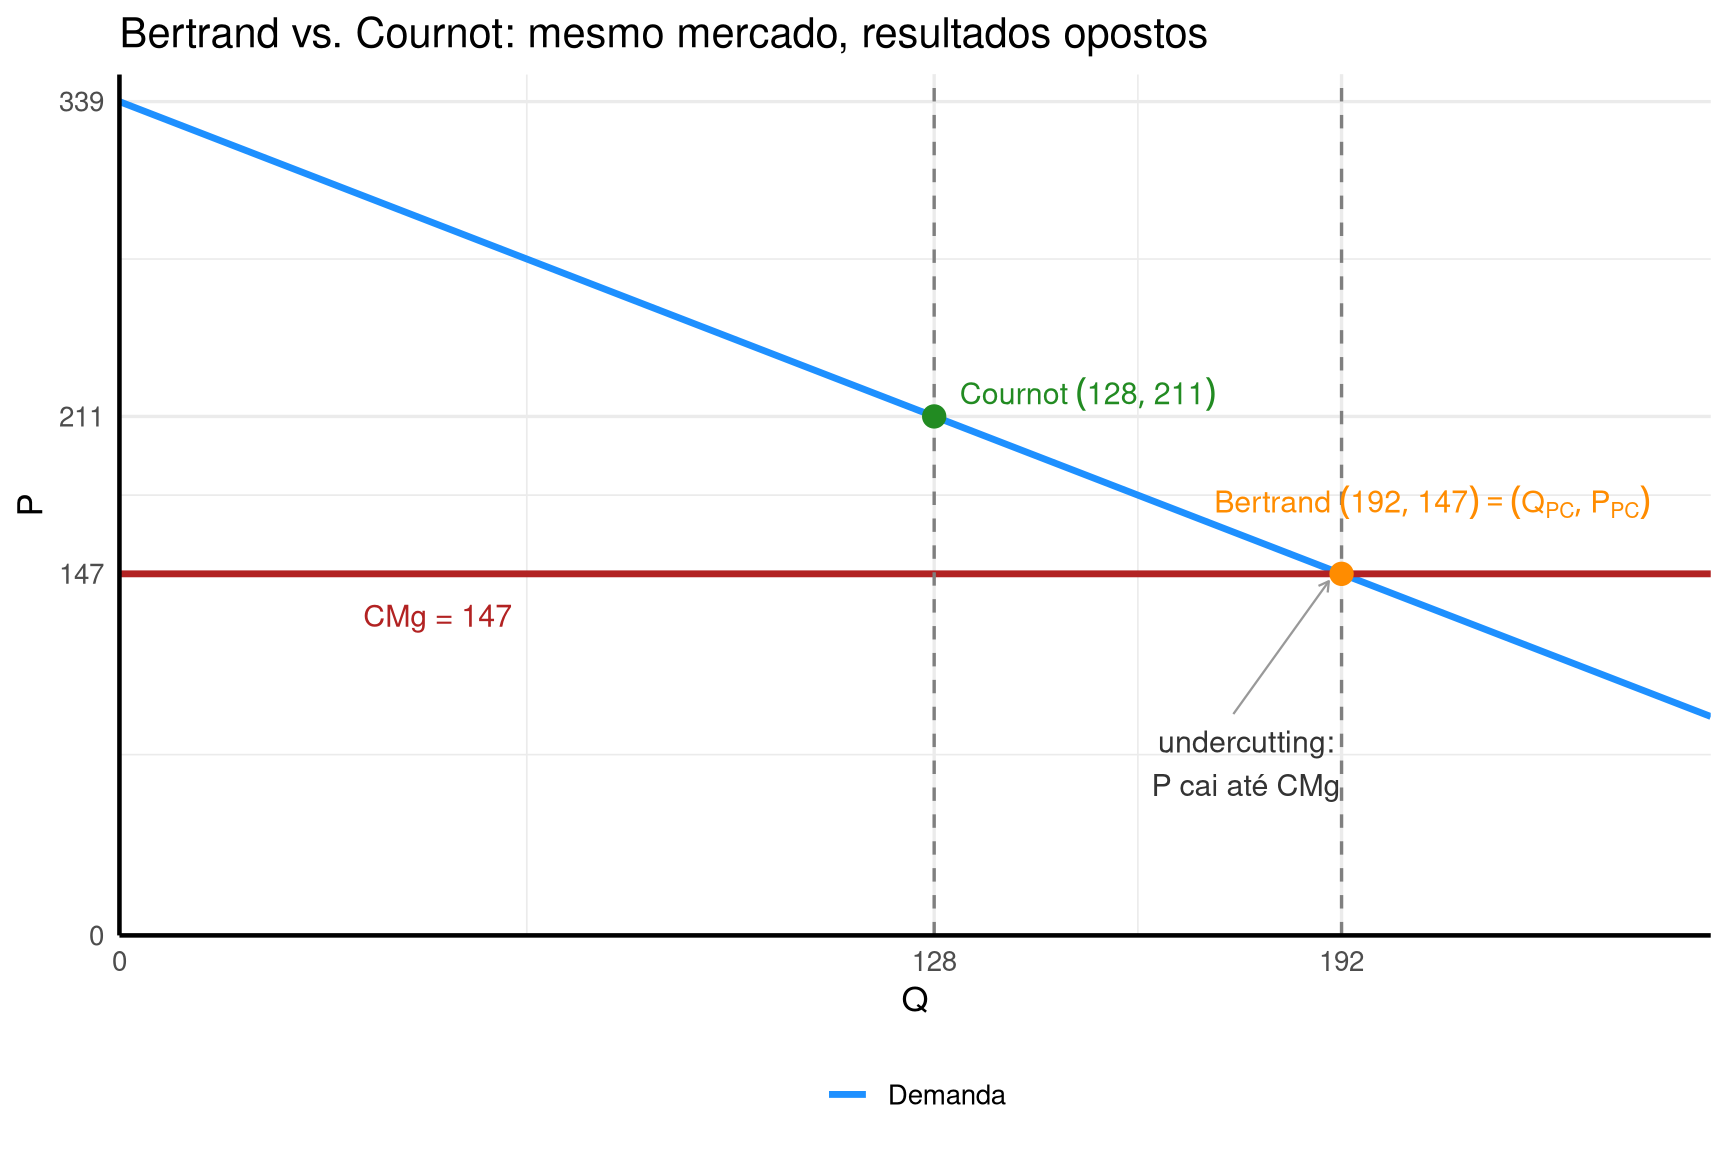
O paradoxo de Bertrand. Em Cournot, o resultado competitivo (\(P = CMg\)) só aparece no limite, quando o número de firmas cresce indefinidamente; com poucas firmas o preço fica acima do custo. Em Bertrand bastam duas firmas para chegar exatamente ao resultado de concorrência perfeita. Dois competidores entregam o que a teoria associava a um mercado atomizado: é esse contraste que se chama paradoxo de Bertrand. Competir em preços é muito mais agressivo que competir em quantidades.
As hipóteses que sustentam o resultado. O \(P = CMg\) tão limpo depende de quatro hipóteses fortes:
bem homogêneo: se os produtos forem diferenciados, o consumidor não troca de firma por um centavo e cada uma mantém margem;
sem limite de capacidade: a firma vencedora precisa conseguir atender o mercado inteiro; com capacidade limitada, a rival ainda vende ao preço alto para a demanda residual;
jogo único: em interação repetida, a ameaça de retaliação pode sustentar preços acima do custo (ver Note 11.5);
informação perfeita: o consumidor precisa observar e comparar os dois preços sem custo.
Relaxar qualquer uma restaura margem positiva. O paradoxo é o caso-limite, não a regra: por isso mercados reais raramente exibem \(P = CMg\) puro.
Por que o lucro econômico tende a zero
Concorrência perfeita e Bertrand chegam ao mesmo ponto, \(P = CMg\) e lucro econômico nulo, por forças diferentes.
Concorrência perfeita: livre entrada e saída. Lucro econômico positivo atrai novas firmas; a oferta cresce e o preço cai. Prejuízo expulsa firmas; a oferta encolhe e o preço sobe. O ajuste no número de firmas só para quando o lucro econômico zera, com \(P\) no mínimo do custo médio.
Bertrand: undercutting entre as firmas presentes. O número de firmas não muda, bastam duas. Cada uma corta o preço para tomar o mercado da rival, e a espiral só para em \(P = CMg\). Aqui o que se ajusta é o preço, não a quantidade de firmas.
A força competitiva segue a mesma ideia; o que difere é o ajuste: o número de firmas na concorrência perfeita, o preço cobrado pelas firmas existentes em Bertrand. É por isso que Bertrand atinge o resultado competitivo com apenas duas firmas.
Lucro econômico zero não é prejuízo: ele já desconta o custo de oportunidade de todos os fatores, inclusive capital e trabalho do empresário. A firma cobre exatamente esse custo, ganha o retorno normal e tem motivo para continuar operando. O lucro contábil segue positivo.
Exercício Resolvido
Mesmo mercado: \(P = 339 - Q\), \(CMg = 147\).
Passo 1: ambas cobram acima do CMg
Suponha \(P_A = P_U = 200 > 147\). Mercado dividido: cada firma vende \(Q(200)/2 = (339-200)/2 = 69{,}5\). Lucro de cada uma: \((200 - 147) \cdot 69{,}5 = 3\,683{,}5\). Aparentemente positivo.
Passo 2: A reduz preço marginalmente para \(P_A = 199\)
A captura todo o mercado: \(Q(199) = 339 - 199 = 140\). Lucro de A:
Mesmo mercado, mesma estrutura de custos, mesmo número de firmas — resultados radicalmente diferentes. A regra de seleção da variável estratégica importa muito.
Implementação em R
Código
cor1 <-"dodgerblue"cor2 <-"firebrick"cor3 <-"forestgreen"cor4 <-"darkorange"P_d <-function(Q) 339- Qmc <-147Q <-seq(0, 250, by =1)df <-tibble(Q = Q, demanda =P_d(Q))ggplot() +geom_line(data = df, aes(x = Q, y = demanda, color ="Demanda"),linewidth =1.2) +geom_hline(yintercept = mc, color = cor2, linewidth =1.2) +geom_vline(xintercept =128, linetype ="dashed", color ="gray50") +geom_vline(xintercept =192, linetype ="dashed", color ="gray50") +annotate("point", x =128, y =211, color = cor3, size =3.5) +annotate("point", x =192, y =147, color = cor4, size =3.5) +annotate("text", x =132, y =220,label =TeX(r"(Cournot $(128, 211)$)"),color = cor3, hjust =0, size =4) +annotate("text", x =172, y =176,label =TeX(r"(Bertrand $(192, 147) = (Q_{PC}, P_{PC})$)"),color = cor4, hjust =0, size =4) +annotate("text", x =50, y =130, label ="CMg = 147",color = cor2, size =4) +# Anotação na área limpa abaixo da curva de CMg, com seta apontando# para o ponto Bertrandannotate("segment", x =175, xend =190, y =90, yend =144,arrow =arrow(length =unit(0.15, "cm")),color ="gray60", linewidth =0.4) +annotate("text", x =177, y =70,label ="undercutting:\nP cai até CMg",color ="gray20", size =4) +scale_color_manual(values =c(Demanda = cor1)) +scale_x_continuous(limits =c(0, 250), expand =c(0, 0),breaks =c(0, 128, 192),labels =c("0", "128", "192")) +scale_y_continuous(limits =c(0, 350), expand =c(0, 0),breaks =c(0, 147, 211, 339),labels =c("0", "147", "211", "339")) +labs(title ="Bertrand vs. Cournot: mesmo mercado, resultados opostos",x ="Q", y ="P", color =NULL ) +theme_minimal(base_size =13) +theme(axis.line =element_line(color ="black", linewidth =0.8),legend.position ="bottom" )
Interpretação
Por que a realidade não bate com Bertrand puro. O modelo prediz \(P = CMg\) com 2 firmas. Mas observamos margens positivas mesmo em mercados duopolísticos. As premissas são fortes:
Produtos homogêneos. Sem fidelidade à marca. Realidade: Coke e Pepsi vendem refrigerantes “iguais” mas têm clientes leais. Diferenciação restaura margem.
Capacidade ilimitada. Firma com menor preço atende qualquer demanda. Realidade: capacidade limitada (Bertrand-Edgeworth) força firmas a aceitarem preço maior do que compensa o custo de não atender todo mundo.
Informação perfeita. Consumidor sempre conhece os preços. Realidade: comparação custosa (tempo, esforço); margem positiva pode persistir em mercados com busca dispendiosa.
Bertrand vs. Cournot: qual escolher? A escolha entre os modelos depende do horizonte de ajuste:
Cournot é melhor quando capacidade é fixa no curto prazo. A firma escolhe quantidade hoje; preço se ajusta no mercado. Indústrias: automóveis, hotéis, navegação.
Bertrand é melhor quando capacidade ajusta rapidamente. A firma escolhe preço; produção segue demanda. Indústrias: software digital, e-books, streaming.
A maioria dos mercados reais é uma mistura. O modelo correto é uma simplificação que captura o eixo de ajuste lento.
Aplicação real
Cereais matinais. Se Kellogg’s anuncia preço promocional, a fábrica abastece prateleiras no dia seguinte. Capacidade flexível → competição em preços (Bertrand). Margens reais permanecem positivas pela diferenciação de marca (KCorn vs. Cheerios não são substitutos perfeitos).
Combustível em postos próximos. Postos competem pelo cliente que passa de carro: produto homogêneo (gasolina é gasolina), capacidade flexível (tanque enchido toda madrugada), informação razoável (preço visível na placa). Tendência a \(P \approx CMg\), com pequena margem por custos de troca (parar, virar à direita, fazer fila).
Comparadores de preços online. Trivago, Skyscanner, Buscapé reduzem custo de comparação. Empurra mercados em direção a Bertrand (quem cobra mais perde demanda imediatamente). Margens caem; competição se intensifica.
Note 11.5: Cartel: monopólio coletivo e instabilidade
Símbolo
Significado
colusão
acordo (explícito ou tácito) entre firmas para reduzir competição
ponto eficiente do cartel
\(Q_M\) dividido entre membros
desvio unilateral
trapaça em que uma firma produz mais que sua quota
Desenvolvimento Teórico
A lógica do cartel. Se as firmas competem (Cournot ou Bertrand), o lucro agregado é menor do que se elas se coordenassem para agir como um monopolista único. Em vez de competir, podem fazer conluio: combinam produzir conjuntamente \(Q_M\) (a quantidade de monopólio), repartem essa produção em quotas e dividem os lucros. Por construção, é a maior soma de lucros possível dado o mercado.
O cartel é um Dilema do Prisioneiro. A estrutura é a mesma de Note 11.1, com “cumprir a quota / produzir além dela” no lugar de “silêncio / delatar”. O ponto do cartel é Pareto-superior ao de Cournot (as duas firmas lucram mais cumprindo), mas não é equilíbrio de Nash. Para ver isso, basta checar a melhor resposta de cada firma:
se a rival cumpre sua quota, a firma ganha produzindo além dela: rouba participação e o preço cai pouco;
se a rival trapaceia, a firma também prefere trapacear: cumprir a quota sozinha seria absorver toda a queda de preço.
Produzir além da quota é melhor resposta nos dois casos, logo é estratégia dominante, como “delatar” no dilema. O efeito-envenenamento da própria expansão (ver Note 10.1 em monopólio) é parcialmente jogado sobre a rival, e é isso que torna o desvio tentador.
Sustentação via repetição. Num jogo de um único período o cartel desmorona: as duas firmas trapaceiam e caem para Cournot. Ele só sobrevive como jogo repetido de horizonte longo, e três condições precisam valer ao mesmo tempo:
Horizonte longo e futuro valorizado. O ganho recorrente de cooperar precisa superar o ganho imediato de trair. É a condição do fator de desconto de Note 11.1: \(\delta\) alto o bastante. Horizonte finito conhecido quebra a cooperação por indução reversa.
Detecção de trapaça. A firma leal precisa perceber o desvio para poder reagir. Quanto mais membros e mais opaco o mercado, mais difícil detectar, e mais frágil o cartel.
Retaliação crível. A ameaça “se você desviar, volto a Cournot para sempre” só disciplina se for crível, ou seja, se de fato compensar executá-la quando chegar a hora.
As três condições são apertadas, e por isso cartéis colapsam com frequência. Somam-se a elas as leis antitruste, que encarecem a coordenação e abrem caminho para a delação.
Exercício Resolvido
Enunciado. Mesmo mercado-fio-condutor: demanda \(P = 339 - Q\) e \(CMg = 147\) para as duas firmas, American (A) e United (U). Em vez de competir, elas consideram formar um cartel: produzir juntas a quantidade de monopólio, repartir em quotas iguais e dividir o lucro. O exercício verifica se o acordo se sustenta, comparando o que A ganha em três situações: cumprir a quota, trapacear sozinha (produzir além da quota enquanto U permanece leal) e o desfecho quando as duas cedem à mesma tentação.
Passo 1: solução de monopólio (cartel)
O cartel age como um monopolista único: escolhe o \(Q\) total que maximiza o lucro conjunto. A receita do cartel é \(R = P \cdot Q = (339 - Q)\,Q = 339\,Q - Q^2\), logo a receita marginal é a derivada da receita:
\[RMg = \frac{dR}{dQ} = 339 - 2Q\]
O cartel produz até onde a receita marginal iguala o custo marginal, \(RMg = CMg\):
Como o custo marginal é constante (\(CMg = 147\)), o custo total de cada firma é \(CT_i = 147\,q_i\) e o custo médio coincide com o marginal. O lucro é a receita menos o custo:
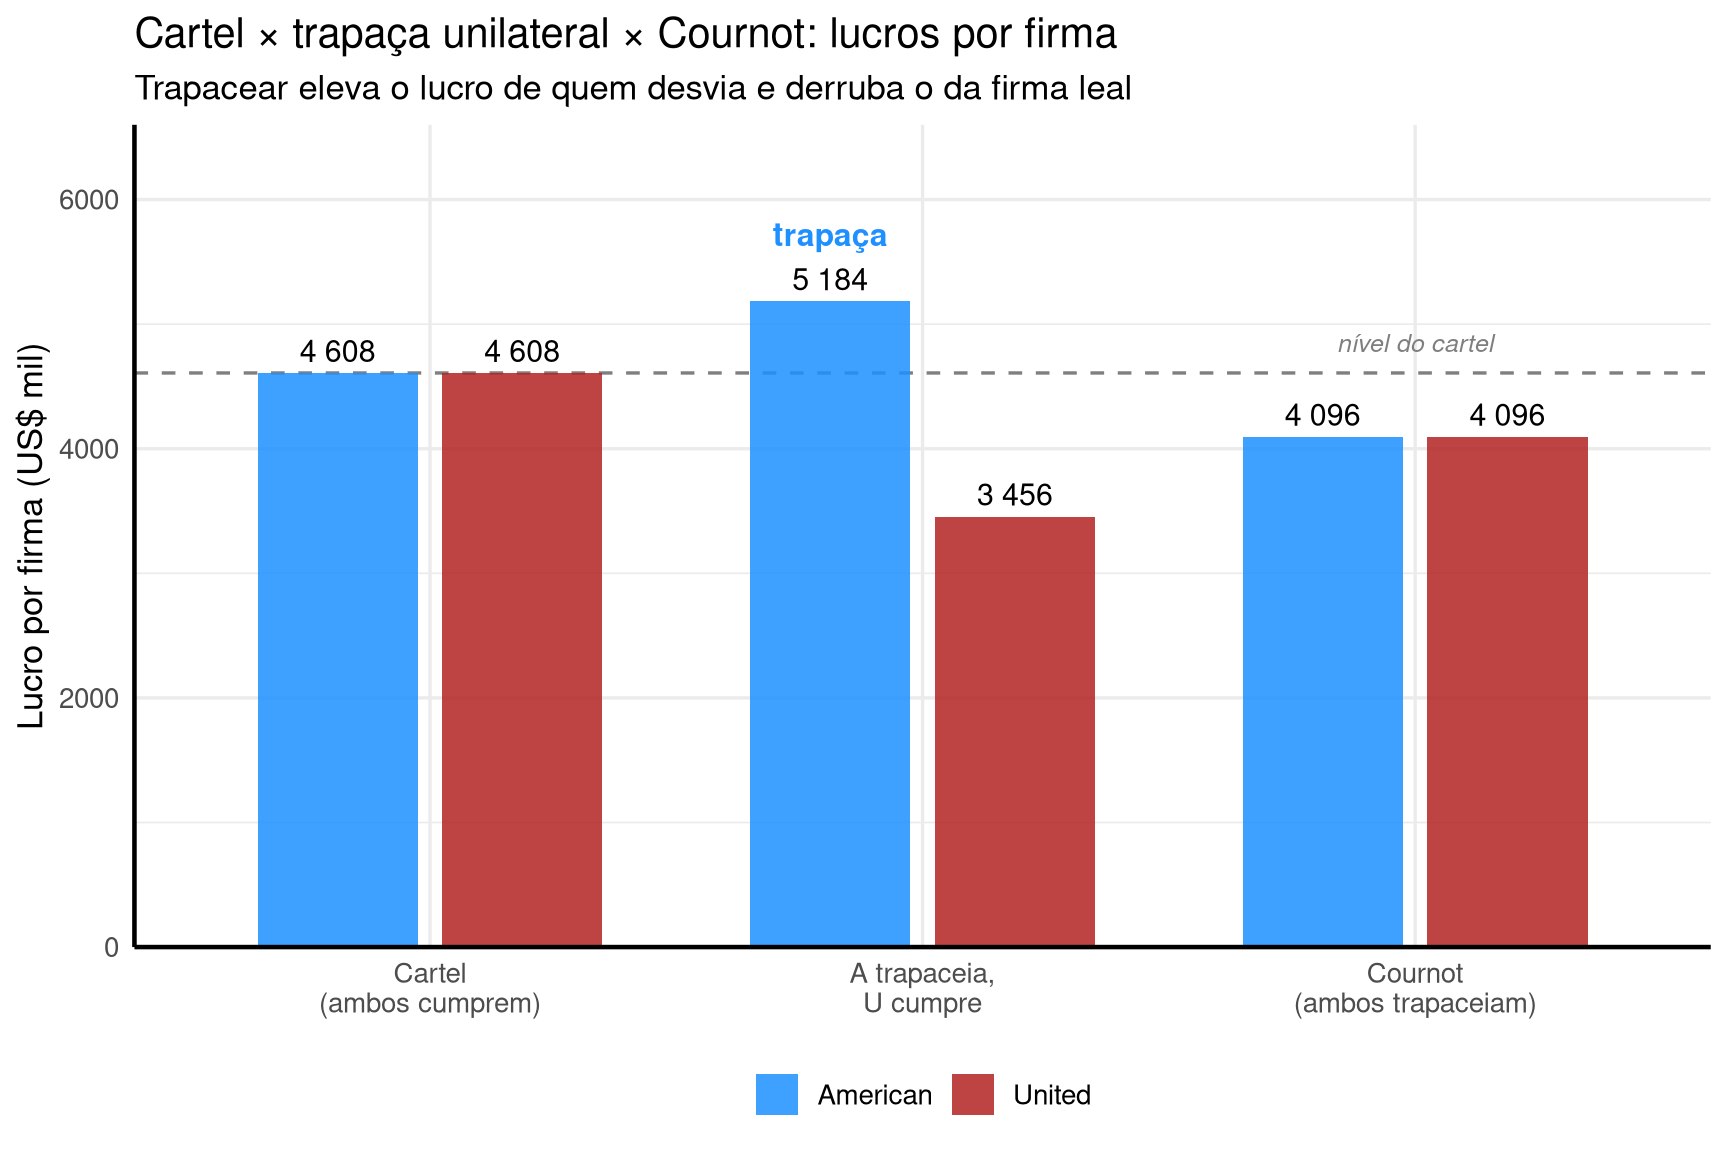
Comparação com Cournot: 4 608 > 4 096. Cartel é mais lucrativo que competição em quantidades.
Passo 4: incentivo a trair (desvio unilateral de A)
Suponha que A acredite que U cumprirá a quota, mantendo \(q_U = 48\). A pergunta de A é: tomando \(q_U = 48\) como dado, qual \(q_A\) maximiza seu lucro? Esse é exatamente o problema de Cournot (escolher a própria quantidade tratando a da rival como fixa), e por isso vale a função de melhor resposta de Note 11.2. Derivando-a para este caso:
A ganha 576 sobre o cartel (\(5\,184 - 4\,608\)). U perde 1 152 (\(4\,608 - 3\,456\)). Total cai 576: parte do ganho de A vem de U, parte se evapora pela queda do preço.
Passo 7: a tentação é simétrica
U tem o mesmo incentivo. Se U trapaceia e A cumpre, U ganha 5 184 e A fica com 3 456. Sem coordenação repetida com retaliação, ambos trapaceiam: caem para Cournot, \(\pi = 4\,096\) cada. Pior que cartel para ambos.
Implementação em R
Código
cor1 <-"dodgerblue"cor2 <-"firebrick"cor3 <-"forestgreen"cor4 <-"darkorange"# Lucros nos três cenários (US$ mil), por firmadf <-tibble(cenario =c("Cartel\n(ambos cumprem)","A trapaceia,\nU cumpre","Cournot\n(ambos trapaceiam)"),pi_A =c(4608, 5184, 4096),pi_U =c(4608, 3456, 4096)) |>pivot_longer(c(pi_A, pi_U), names_to ="firma", values_to ="lucro") |>mutate(firma =ifelse(firma =="pi_A", "American", "United"),cenario =factor(cenario, levels =c("Cartel\n(ambos cumprem)","A trapaceia,\nU cumpre","Cournot\n(ambos trapaceiam)")),# rótulo só na barra da firma que desviarotulo_trapaca =if_else( cenario =="A trapaceia,\nU cumpre"& firma =="American","trapaça", NA_character_))nivel_cartel <-4608# rótulo da linha de referência (todas as categorias presentes p/ manter a ordem)lbl_cartel <-tibble(cenario =factor(levels(df$cenario), levels =levels(df$cenario)),lucro = nivel_cartel +240,txt =c(NA, NA, "nível do cartel"))ggplot(df, aes(x = cenario, y = lucro, fill = firma)) +# linha de referência: lucro de cada firma sob o cartelgeom_hline(yintercept = nivel_cartel, linetype ="dashed",color ="gray50", linewidth =0.6) +geom_text(data = lbl_cartel, aes(x = cenario, y = lucro, label = txt),inherit.aes =FALSE, na.rm =TRUE,color ="gray50", size =3.3, fontface ="italic") +geom_col(position =position_dodge(width =0.75), width =0.65,alpha =0.85) +geom_text(aes(label =format(lucro, big.mark =" ")),position =position_dodge(width =0.75),vjust =-0.5, size =4) +# destaque: rótulo "trapaça" sobre a barra de quem desviageom_text(aes(label = rotulo_trapaca),position =position_dodge(width =0.75), vjust =-2.4,color = cor1, fontface ="bold", size =4.2, na.rm =TRUE) +scale_fill_manual(values =c(American = cor1, United = cor2)) +scale_y_continuous(limits =c(0, 6600), expand =c(0, 0)) +labs(title ="Cartel × trapaça unilateral × Cournot: lucros por firma",subtitle ="Trapacear eleva o lucro de quem desvia e derruba o da firma leal",x =NULL, y ="Lucro por firma (US$ mil)",fill =NULL ) +theme_minimal(base_size =13) +theme(axis.line =element_line(color ="black", linewidth =0.8),legend.position ="bottom" )
Interpretação
Por que cartéis colapsam. O ponto do cartel é Pareto-superior ao de Cournot mas não é Nash. Isso significa: ambos os membros gostariam de cumprir, mas ninguém tem incentivo individual para cumprir se acredita que o outro pode trair. A solução é jogos repetidos com retaliação crível. Em duopólio com horizonte longo e detecção rápida de trapaça, cartel sustenta-se. Em mercados com muitas firmas (como mercúrio quando Rússia entrou), detecção é difícil e o cartel quebra.
Por que advogados de cartel pensam diferente. Para o jurista, a chave do cartel é a legalidade: leis antitruste tornam acordos explícitos crime. Para o economista, mesmo sem lei, o cartel é instável pelos incentivos. As duas leituras se complementam: leis aumentam o custo de coordenar (qualquer evidência escrita pode virar prova); incentivos derrubam o cartel mesmo onde as leis falham. Daí o uso massivo de programas de leniência (perdão para o primeiro a denunciar): combinam direito penal com indução reversa para quebrar a confiança entre membros.
Programa de leniência e jogo finito. Quando uma autoridade antitruste cria um programa onde “o primeiro a denunciar paga punição mínima”, o cartel vira jogo de horizonte finito implícito: cada membro sabe que, se o outro denunciar primeiro, ele paga muito mais. Indução reversa empurra todos a denunciar quando suspeitam que o cartel está perto de ser exposto.
Aplicação real
Standard Oil → Sherman Antitrust Act (1890). Rockefeller dominava o setor de petróleo via trusts — estruturas em que firmas independentes entregavam decisões de preço e produção a um conselho comum, operando como monopólio coletivo. A reação pública gerou a Sherman Antitrust Act, primeira grande legislação antitruste dos EUA. Daí o nome “antitrust”.
Estúdios de Hollywood × cinemas (1930-40). Estúdios compraram redes de cinema. Um cinema da Warner só exibia filmes da Warner, eliminando competição em cidades pequenas. Antitruste eventualmente desmontou (caso US v. Paramount, 1948).
British Airways × Virgin Atlantic (2004-2007). As duas dominantes nas rotas transatlânticas combinaram em segredo elevar a sobretaxa de combustível de US$ 10 para US$ 120 por bilhete. Sustentou-se enquanto pareceu jogo infinito. Quando os advogados da Virgin perceberam que era jogo finito (alguém eventualmente trairia), aplicaram indução reversa: foram primeiro ao regulador. Resultado: Virgin com punição leve (programa de leniência), BA com multa de US$ 500 mi.
Cartel do mercúrio (Itália-Espanha → Rússia). Por décadas, Itália e Espanha controlavam o mercado de mercúrio. Quando a Rússia começou a produzir, o cartel desfez-se. Não por novas leis: por muitas firmas tornarem coordenação difícil (Note 11.6 retoma esse ponto).
Note 11.6: Bem-estar: peso morto e markup com \(n\) firmas
Símbolo
Significado
\(ExC\)
excedente do consumidor
\(\pi^{total}\)
soma dos lucros das firmas
\(ExT\)
excedente total = \(ExC + \pi^{total}\)
\(PPM\)
perda de peso morto vs. CP
Lerner generalizada
\((P-CMg)/P = -1/(n\varepsilon)\)
Desenvolvimento Teórico
Hierarquia de bem-estar. No mesmo mercado-fio-condutor, os 4 modelos geram \(ExT\) diferente. Bertrand é eficiente (\(P = CMg\), \(PPM = 0\)). Monopólio/cartel é o pior (\(PPM\) máximo). Cournot e Stackelberg são intermediários.
Curiosidade do Stackelberg. Apesar de destruir lucro total (Note 11.3), Stackelberg gera mais bem-estar agregado que Cournot, porque produz mais quantidade (\(Q = 144 > 128\)) — captura mais trocas mutuamente benéficas. A vantagem do líder é redistributiva entre firmas, mas favorável aos consumidores.
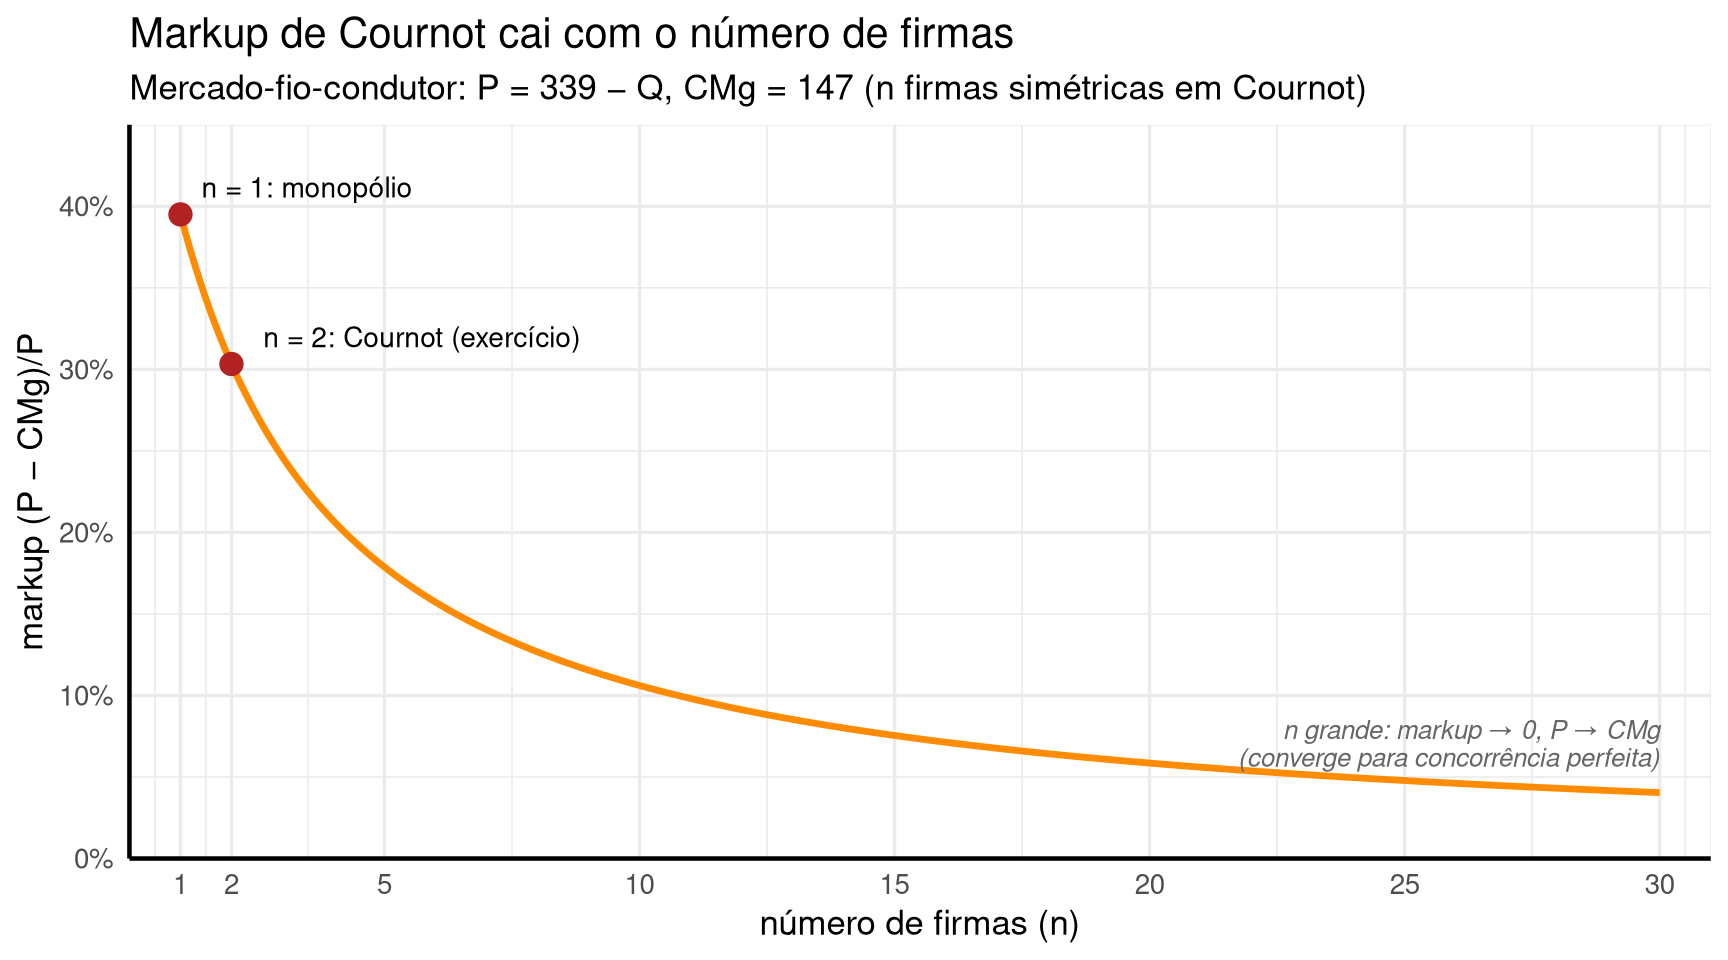
Regra de Lerner generalizada para Cournot. Em monopólio, markup \(= (P-CMg)/P = -1/\varepsilon\) (ver Note 10.3 em monopólio). Em Cournot com \(n\) firmas simétricas:
À medida que \(n \to \infty\), markup \(\to 0\) — Cournot converge para CP. Quando \(n = 1\), fórmula reduz ao monopólio. Dois fatores disciplinam o oligopolista: elasticidade da demanda e número de firmas.
Exercício Resolvido
Mesmo mercado-fio-condutor.
Passo 1: \(ExC\) por modelo (triângulo entre demanda e preço)
Em demanda linear \(P = 339 - Q\), o intercepto vertical é 339. \(ExC\) é o triângulo com base \(Q\) e altura \(339 - P\):
cor2 <-"firebrick"cor4 <-"darkorange"# Markup de Cournot vs. número de firmas (mercado-fio-condutor)# Regra de Lerner: (P - CMg)/P = -1/(n * epsilon). Para P = a - Q e CMg = cmg,# o equilíbrio de Cournot com n firmas simétricas dá markup(n) = (a - cmg)/(a + n*cmg).a <-339cmg <-147markup_n <-function(n) (a - cmg) / (a + n * cmg)df_markup <-tibble(n =seq(1, 30, by =0.1), markup =markup_n(n))# pontos de referência: monopólio (n = 1) e o Cournot do exercício (n = 2)df_pts <-tibble(n =c(1, 2),markup =markup_n(c(1, 2)),rotulo =c("n = 1: monopólio", "n = 2: Cournot (exercício)"))ggplot(df_markup, aes(x = n, y = markup)) +geom_line(color = cor4, linewidth =1.2) +geom_point(data = df_pts, aes(x = n, y = markup),color = cor2, size =3.5) +geom_text(data = df_pts, aes(x = n, y = markup, label = rotulo),hjust =-0.1, vjust =-0.8, size =3.7) +annotate("text", x =30, y =0.085,label ="n grande: markup → 0, P → CMg\n(converge para concorrência perfeita)",color ="gray40", size =3.4, hjust =1, vjust =1,lineheight =0.9, fontface ="italic") +scale_x_continuous(limits =c(0, 31), expand =c(0, 0),breaks =c(1, 2, 5, 10, 15, 20, 25, 30)) +scale_y_continuous(limits =c(0, 0.45), expand =c(0, 0),labels = scales::label_percent(accuracy =1)) +labs(title ="Markup de Cournot cai com o número de firmas",subtitle ="Mercado-fio-condutor: P = 339 − Q, CMg = 147 (n firmas simétricas em Cournot)",x ="número de firmas (n)", y ="markup (P − CMg)/P" ) +theme_minimal(base_size =13) +theme(axis.line =element_line(color ="black", linewidth =0.8) )
Interpretação
Stackelberg favorece o consumidor. Embora destrua lucro total, Stackelberg dá mais bem-estar agregado que Cournot — porque a vantagem do líder vem expandindo a quantidade. Líder produz acima da quantidade Cournot (96 > 64); seguidor produz menos (48 < 64); efeito líquido na quantidade total é positivo (144 > 128). Resultado: consumidores ganham. Para a sociedade no agregado, Stackelberg é melhor que Cournot, mesmo que para o setor seja pior.
Convergência para CP com \(n\) grande. Pela regra de Lerner, o markup cai conforme \(n\) cresce. Resolvendo o equilíbrio de Cournot do mercado-fio-condutor para \(n\) firmas simétricas, a fórmula fechada é \(\text{markup} = (P - CMg)/P = 192/(339 + 147n)\): com \(n = 10\) cai para \(\approx 0{,}106\) (11%); com \(n = 50\), \(\approx 0{,}025\) (2,5%). Para fins práticos, mercados com algumas dezenas de firmas competindo à la Cournot já têm markup baixo, próximo do de CP. Por isso o referencial empírico de “indústria competitiva” não exige rigorosamente \(n \to \infty\), basta \(n\) grande o suficiente.
Indireto: \(n\) grande mata cartel. Além do efeito direto na fórmula do markup, \(n\) tem efeito sobre a sustentabilidade do cartel. Mais membros → mais incentivos para alguém trair → menos detecção rápida → cartel quebra. O cartel do mercúrio durou enquanto Itália e Espanha eram os únicos vendedores; quebrou quando a Rússia entrou.
Empírica: markups crescentes nos EUA. Estimativas recentes (De Loecker, Eeckhout, Unger 2020) sugerem markup médio das firmas listadas nos EUA passou de ~21% em 1980 para ~61% em 2016. Causas debatidas: aumento de poder de mercado em setores específicos (tech, farma); concentração via fusões; barreiras à entrada (patentes, redes). Pela regra de Lerner, isso pode refletir queda em \(n\) (menos competidores) e/ou em \(|\varepsilon|\) (demanda mais inelástica).
Aplicação real
Cartel do mercúrio. Décadas com Itália e Espanha como únicos produtores. Cartel sustentado: \(n = 2\), fácil monitoramento, retaliação crível. Quando Rússia entrou no mercado nos anos 1990, \(n = 3\), monitoramento ficou mais difícil, e o cartel desmoronou. \(n\) é um parâmetro de estrutura do mercado tão importante quanto a elasticidade.
OPEP. Cartel com ~13 países-membros + grupo “OPEP+” com Rússia e outros. Cumprimento de cotas é instável: cada país tem incentivo individual para produzir mais que sua quota. Sucessos parciais (1973, 1979 — choques do petróleo) seguidos de períodos de descumprimento. Tecnologia de fracking nos EUA e Canadá (a partir de 2010) aumentou efetivamente \(n\), reduzindo poder do cartel.
Note 11.7: Síntese: comparação dos 4 modelos e políticas antitruste
Desenvolvimento Teórico
Quando usar cada modelo. A escolha do modelo depende de duas características do mercado real:
Característica
Modelo apropriado
Capacidade lenta de ajustar; firmas escolhem capacidade
Cournot
Capacidade flexível; firmas escolhem preço
Bertrand
Existe líder consagrado com comprometimento crível
Stackelberg
Poucas firmas, interação repetida, ausência de antitruste forte
Cartel (instável)
A maioria dos mercados reais é uma mistura: setores onde firmas competem em preço dia a dia (Bertrand-like) mas escolhem capacidade trimestralmente (Cournot-like). O modelo certo é o que captura a dimensão lenta de ajuste — porque é nessa dimensão que o poder de mercado se exerce.
O que disciplina o oligopolista. Conforme Note 10.7 em monopólio, três forças limitam o poder de mercado: elasticidade da demanda, ameaça de entrada, regulação. No oligopólio, agrega-se uma quarta força: a interação estratégica entre as poucas firmas presentes. Cournot, Stackelberg, Bertrand e cartel são quatro maneiras diferentes de essa interação se manifestar. Política antitruste é a ferramenta para corrigir falhas onde as outras forças não bastam.
Tabela comparativa
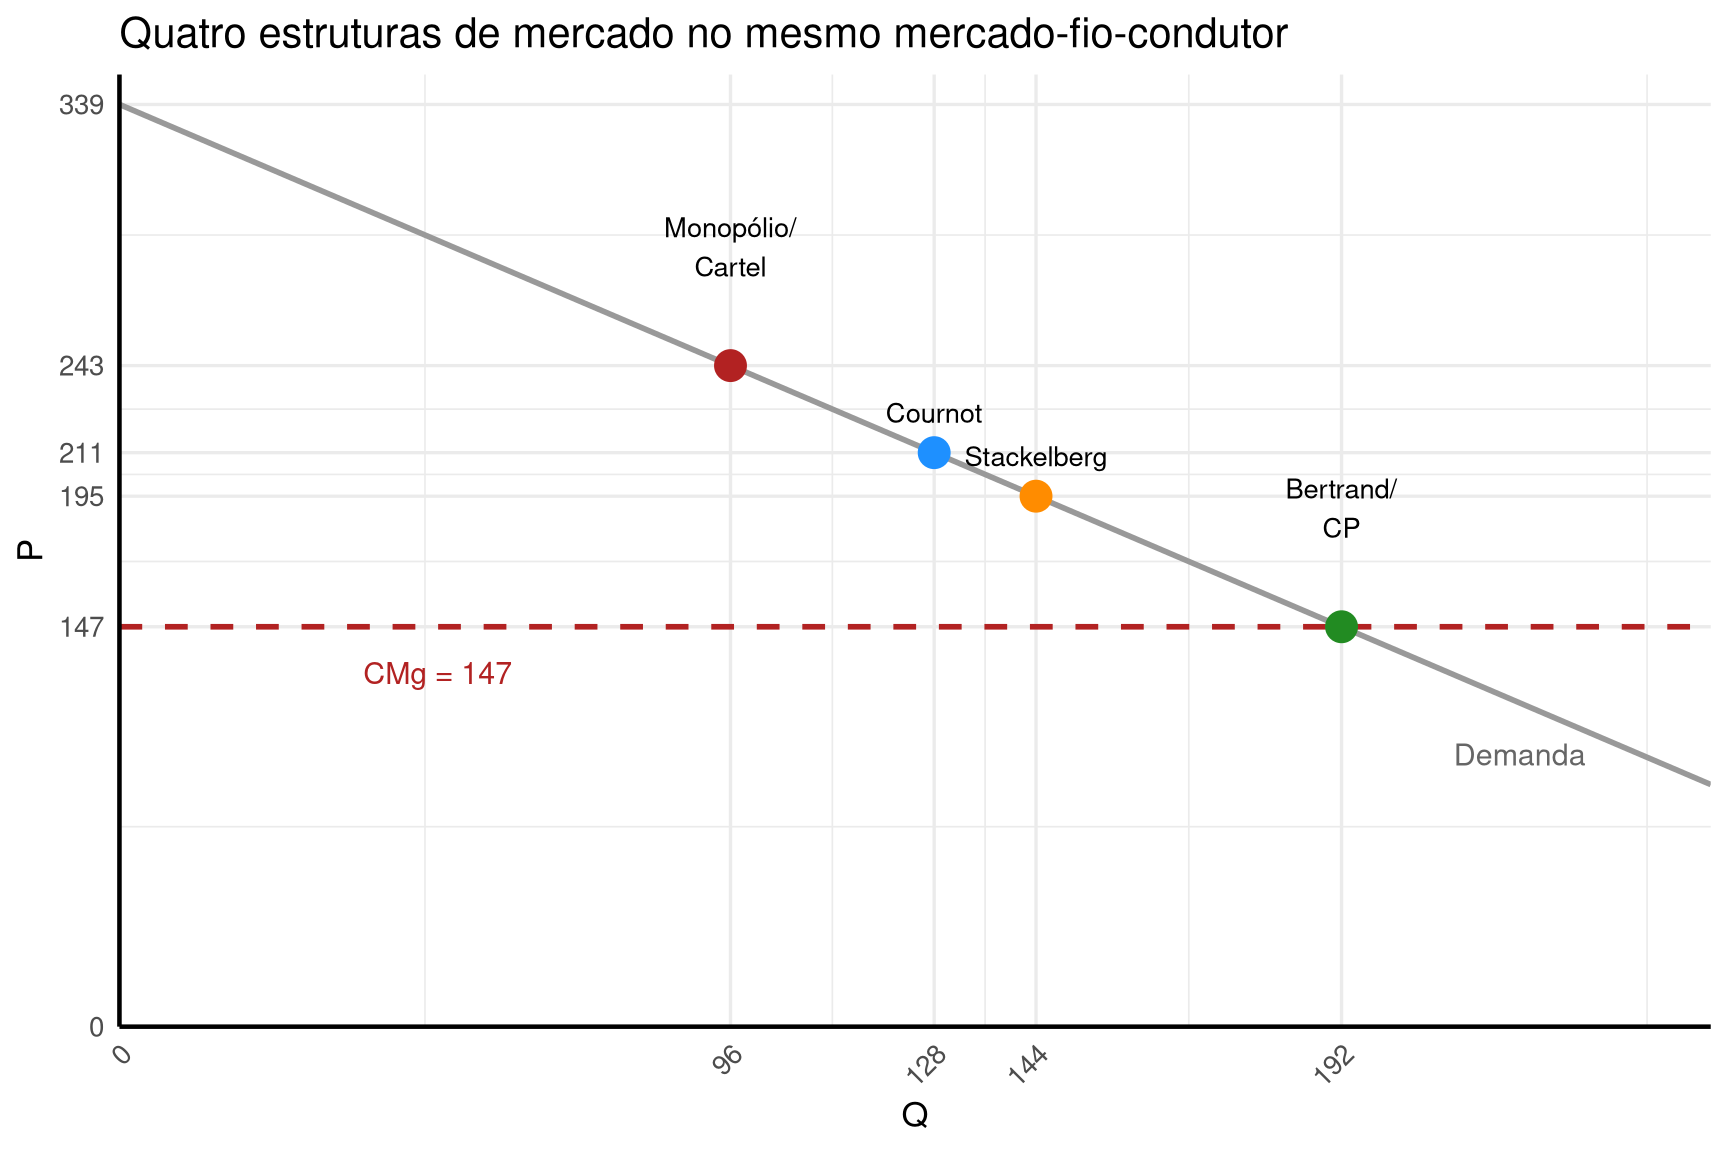
Aplicando os 4 modelos ao mesmo mercado-fio-condutor (\(P = 339 - Q\), \(CMg = 147\)):
Modelo
\(Q\)
\(P\)
\(\pi\)/firma
\(\pi^{total}\)
\(ExC\)
\(ExT\)
\(PPM\)
Monopólio/Cartel
96
243
4 608
9 216
4 608
13 824
4 608
Stackelberg (\(q_A = 96, q_U = 48\))
144
195
4 608 / 2 304
6 912
10 368
17 280
1 152
Cournot
128
211
4 096
8 192
8 192
16 384
2 048
Bertrand / CP
192
147
0
0
18 432
18 432
0
Hierarquia em \(Q\): Mon < Sta_A=Mon (líder) < Cou < Sta < Ber. Hierarquia em \(P\): inverso. Hierarquia em \(ExT\): Mon < Cou < Sta < Ber.
Implementação em R
Código
cor1 <-"dodgerblue"cor2 <-"firebrick"cor3 <-"forestgreen"cor4 <-"darkorange"df_comp <-tibble(modelo =c("Monopólio/\nCartel", "Stackelberg", "Cournot","Bertrand/\nCP"),Q =c(96, 144, 128, 192),P =c(243, 195, 211, 147)) |>mutate(modelo =factor(modelo, levels =c("Monopólio/\nCartel", "Cournot", "Stackelberg", "Bertrand/\nCP" )))# Gráfico comparativo: posições no plano (Q, P)P_d <-function(Q) 339- QQ_seq <-seq(0, 250, by =1)df_demanda <-tibble(Q = Q_seq, P =P_d(Q_seq))ggplot() +geom_line(data = df_demanda, aes(x = Q, y = P),color ="gray60", linewidth =1) +geom_hline(yintercept =147, color = cor2, linewidth =1,linetype ="dashed") +geom_point(data = df_comp, aes(x = Q, y = P, color = modelo),size =5) +geom_text(data = df_comp,aes(x = Q, y = P, label = modelo),vjust =-1.5, size =3.6) +scale_color_manual(values =c(`Monopólio/\nCartel`= cor2,Cournot = cor1,Stackelberg = cor4,`Bertrand/\nCP`= cor3)) +annotate("text", x =50, y =130, label ="CMg = 147",color = cor2, size =4) +annotate("text", x =220, y =100, label ="Demanda",color ="gray40", size =4) +scale_x_continuous(limits =c(0, 250), expand =c(0, 0),breaks =c(0, 96, 128, 144, 192),labels =c("0", "96", "128", "144", "192")) +scale_y_continuous(limits =c(0, 350), expand =c(0, 0),breaks =c(0, 147, 195, 211, 243, 339),labels =c("0", "147", "195", "211", "243", "339")) +labs(title ="Quatro estruturas de mercado no mesmo mercado-fio-condutor",x ="Q", y ="P", color =NULL ) +theme_minimal(base_size =13) +theme(axis.line =element_line(color ="black", linewidth =0.8),legend.position ="none",axis.text.x =element_text(angle =45, hjust =1) )
Interpretação
Política antitruste como instrumento. Os 4 modelos descrevem o que acontece em mercados com poucas firmas. Quando o resultado é socialmente custoso (markup alto, \(PPM\) relevante), governos podem intervir. As ferramentas principais:
Proibição de cartéis explícitos. Sherman Act (EUA, 1890), Lei Antitruste (Brasil, 1962), CADE. Penaliza acordos formais de fixação de preços e divisão de mercado. Programas de leniência aceleram colapso.
Controle de fusões e aquisições. CADE no Brasil revisa fusões com volume relevante. Bloqueia ou impõe remédios (alienação de ativos) quando há risco de monopólio.
Vigilância sobre práticas exclusionárias. Empresa dominante que paga para excluir rivais (Google-Apple), abusa de posição em plataforma (Amazon Marketplace), ou amarra produtos (tying).
Regulação direta de monopólios naturais. Tarifas reguladas em água, eletricidade, telecom (ver Note 10.6 em monopólio).
Casos antitruste atuais.
Google × Apple. Google paga ~US$ 10 bi/ano para ser o motor de busca padrão no iPhone. DOJ argumenta que isso é exclusão (paga para tirar concorrentes do acesso), não merit-based competition. Decisão pendente moldará o tratamento de “default agreements” em mercados digitais.
Amazon Marketplace. ~50% do varejo online dos EUA passa pela Amazon; ~40% das vendas no site são de terceiros (FBA — Fulfillment by Amazon), que pagam taxas substanciais. FTC argumenta que Amazon usa poder de plataforma para extrair rendas dos sellers e excluir concorrentes diretos. Amazon argumenta que representa apenas ~8% do varejo total dos EUA — definição do mercado relevante (online vs. todo o varejo) é o ponto-chave da disputa.
Fusões hospitalares nos EUA. Décadas de fusões aprovadas sob argumento de “ganhos de eficiência”. Evidência empírica recente (Cooper et al. 2019, Dafny 2021): fusões aumentaram preços sem reduzir custos. Endurecimento da política de aprovação.
Trade-off central. Política antitruste boa equilibra: (1) deixar firmas grandes operarem se a escala gera eficiência genuína (rede, P&D); (2) impedir abuso de posição e cartéis. Quando a balança pesa para o segundo, intervenção é justificada — mas o regulador enfrenta o mesmo problema de informação assimétrica que limita a regulação direta de monopólio natural.
Aplicação real
Big Tech e o debate moderno. Casos contra Google, Meta, Amazon, Apple acumulam-se desde 2020. Argumentos centrais: domínio de plataformas como gatekeeper (Apple controla o que entra na App Store); pagamentos de exclusão (Google paga para ser default); auto-favorecimento (Amazon promove produtos próprios contra os de terceiros no Marketplace). Em todos os casos, a definição do mercado relevante é decisiva — Apple controla 100% da App Store iOS mas só ~30% do mercado total de smartphones; Amazon domina o varejo online mas é minoria do varejo total. Como definir o mercado define o resultado.
Antitruste e inovação. Há um trade-off histórico entre poder de mercado e incentivos a inovar (ver Note 10.6 em monopólio, sobre patentes). Ferozes restrições antitruste podem reduzir incentivo a P&D; permissividade excessiva concentra poder. A política ótima depende do setor: em farma, patentes (monopólio temporário) protegem investimento alto; em tech, o mesmo argumento é mais frágil porque P&D em software é incremental e os custos fixos são menos extremos.