A economia estuda como pessoas, empresas, governos e outras organizações fazem escolhas, e como essas escolhas determinam a forma como a sociedade utiliza seus recursos. Fazemos escolhas porque os recursos são escassos — não apenas dinheiro, mas também tempo. Ter mais de algo significa abrir mão de outra coisa. A escassez significa que os trade-offs são um fato básico da vida (Pindyck e Rubinfeld, 2013; Varian, 2012).
Pensar como um economista significa aprender a identificar os trade-offs e incentivos presentes em cada situação, as implicações das trocas, o papel da informação e as consequências para a distribuição.
Custo de oportunidade
O custo de oportunidade é o custo do uso de qualquer recurso, medido pelo melhor uso alternativo que poderia ser dado a esse recurso. Em outras palavras, é o valor da melhor alternativa sacrificada quando uma escolha é feita (Perloff, 2022).
Custos irrecuperáveis (sunk costs): são despesas passadas que não podem ser ressarcidas, qualquer que seja a escolha feita no presente. Tomadores de decisão racionais devem ignorá-los, pois não afetam os custos e benefícios futuros de uma decisão.
Custos marginais: a maioria das decisões econômicas se concentra em escolhas na margem, em que o custo marginal (ou adicional) de uma atividade é comparado com os benefícios marginais. Uma decisão racional requer que o benefício marginal seja pelo menos igual ao custo marginal (Nicholson e Snyder, 2018).
Incentivos e preços
Os agentes econômicos fazem escolhas respondendo a incentivos. Dentre os mecanismos de incentivo mais importantes estão os preços. O sistema de preços assegura que os bens cheguem às pessoas e às empresas que estão mais dispostas e capacitadas a pagar por eles (Pindyck e Rubinfeld, 2013).
Contudo, incentivos nem sempre funcionam da maneira esperada. Em alguns contextos, introduzir incentivos monetários pode ter efeito contraproducente — por exemplo, remunerar doadores de sangue pode reduzir as doações, pois transforma um ato pró-social em uma transação comercial.
Formalização Matemática
Restrição orçamentária
A restrição orçamentária representa o conjunto de cestas de consumo acessíveis ao consumidor, dados os preços dos bens e a renda disponível. Para dois bens, \(x_1\) e \(x_2\), com preços \(p_1\) e \(p_2\) e renda \(m\):
\[p_1 x_1 + p_2 x_2 \leq m\]
A igualdade \(p_1 x_1 + p_2 x_2 = m\) define a linha de orçamento, que é o limite superior do conjunto orçamentário.
Interceptos e inclinação
Os interceptos da linha de orçamento indicam a quantidade máxima de cada bem que pode ser adquirida caso toda a renda seja gasta em um único bem:
Intercepto no eixo \(x_1\): \(\dfrac{m}{p_1}\)
Intercepto no eixo \(x_2\): \(\dfrac{m}{p_2}\)
A inclinação da linha de orçamento é dada por:
\[\text{inclinação} = -\frac{p_1}{p_2}\]
Essa inclinação representa o preço relativo do bem 1 em termos do bem 2, ou seja, a taxa à qual o mercado permite trocar o bem 1 pelo bem 2 (Varian, 2012).
Exemplo Numérico
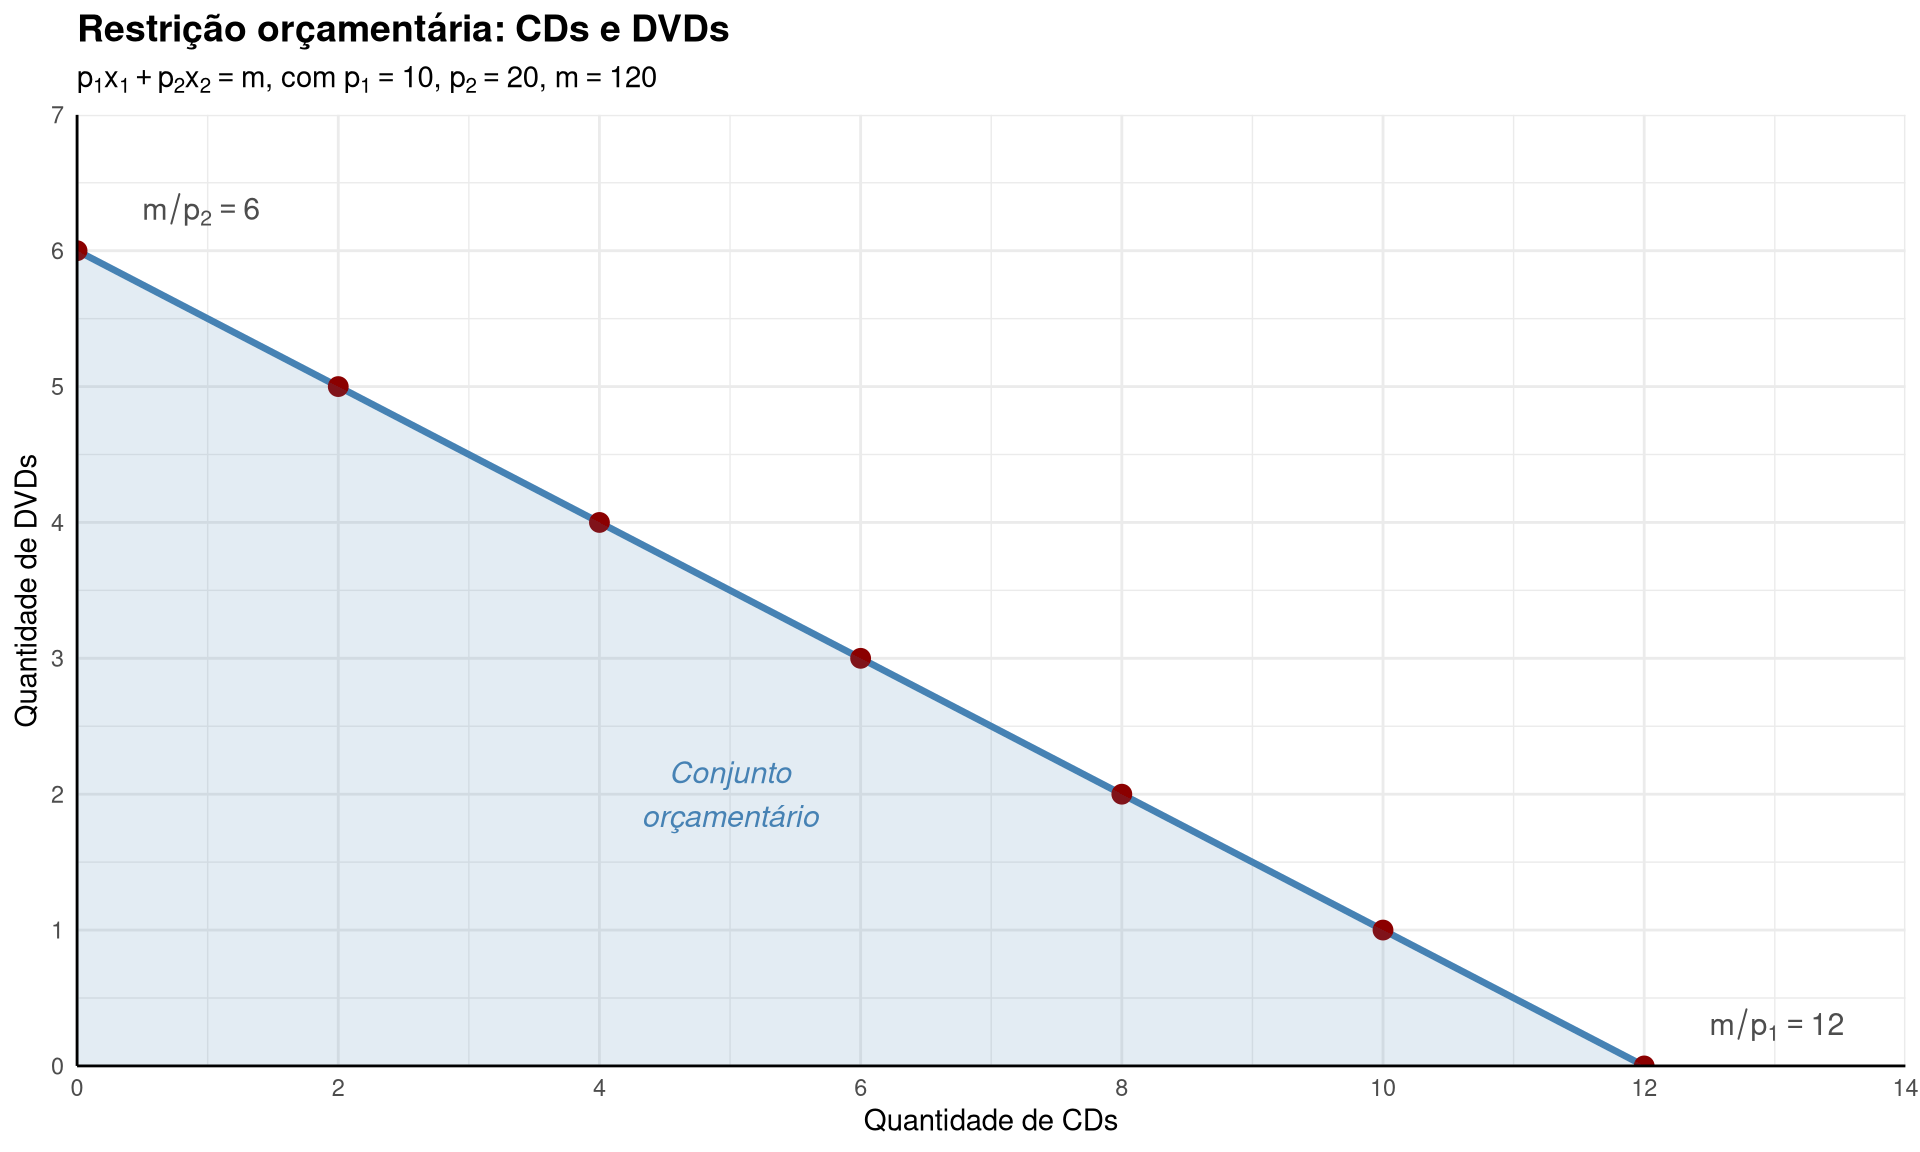
Considere um consumidor com orçamento de R$120 que pode comprar CDs (preço: R$10) e DVDs (preço: R$20).
A restrição orçamentária é:
\[10 \cdot x_{CD} + 20 \cdot x_{DVD} = 120\]
CDs (\(x_{CD}\))
DVDs (\(x_{DVD}\))
Gasto total (R$)
0
6
120
2
5
120
4
4
120
6
3
120
8
2
120
10
1
120
12
0
120
Os interceptos são:
Intercepto em CDs: \(\dfrac{120}{10} = 12\)
Intercepto em DVDs: \(\dfrac{120}{20} = 6\)
O preço relativo (inclinação) é \(-\dfrac{10}{20} = -0{,}5\): ao abrir mão de 1 DVD, o consumidor pode adquirir 2 CDs.
Implementação em R
Código
suppressPackageStartupMessages({library(ggplot2)library(dplyr)library(latex2exp)})# Parâmetrosp1 <-10# preço do CDp2 <-20# preço do DVDm <-120# orçamento# Interceptosint_cd <- m / p1 # 12int_dvd <- m / p2 # 6# Dados da linha de orçamentodados_ro <- tibble::tibble(cd =c(0, int_cd),dvd =c(int_dvd, 0))# Pontos da tabelapontos <- tibble::tibble(cd =seq(0, 12, by =2),dvd = (m - p1 * cd) / p2)# Gráficoggplot() +geom_line(data = dados_ro,aes(x = cd, y = dvd),color ="steelblue",linewidth =1.2 ) +geom_point(data = pontos,aes(x = cd, y = dvd),color ="darkred",size =3 ) +geom_ribbon(data = dados_ro,aes(x = cd, ymin =0, ymax = dvd),fill ="steelblue",alpha =0.15 ) +annotate("text", x = int_cd +0.5, y =0.3,label =paste0("m/p[1] == ", int_cd),parse =TRUE, hjust =0, size =4, color ="gray30" ) +annotate("text", x =0.5, y = int_dvd +0.3,label =paste0("m/p[2] == ", int_dvd),parse =TRUE, hjust =0, size =4, color ="gray30" ) +annotate("text", x =5, y =2,label ="Conjunto\norçamentário",size =4, color ="steelblue", fontface ="italic" ) +labs(title ="Restrição orçamentária: CDs e DVDs",subtitle =TeX(r"($p_1 x_1 + p_2 x_2 = m$, com $p_1 = 10$, $p_2 = 20$, $m = 120$)"),x ="Quantidade de CDs",y ="Quantidade de DVDs" ) +scale_x_continuous(breaks =seq(0, 14, by =2), limits =c(0, 14), expand =c(0, 0)) +scale_y_continuous(breaks =seq(0, 7, by =1), limits =c(0, 7), expand =c(0, 0)) +theme_minimal() +theme(plot.title =element_text(size =14, face ="bold"),plot.subtitle =element_text(size =11),axis.line =element_line(color ="black", linewidth =0.5),axis.title =element_text(size =11) )
Interpretação
A restrição orçamentária ilustra o trade-off fundamental enfrentado pelo consumidor: dado um orçamento fixo de R$120, cada DVD adicional custa 2 CDs (o preço relativo). A área sombreada representa o conjunto orçamentário — todas as combinações acessíveis de CDs e DVDs. Pontos sobre a linha representam combinações que esgotam toda a renda; pontos abaixo da linha representam combinações que deixam parte da renda não utilizada.
A inclinação da reta orçamentária \((-p_1/p_2 = -0{,}5)\) reflete o custo de oportunidade: para obter 1 CD adicional, o consumidor precisa abrir mão de 0,5 DVD (ou, equivalentemente, 1 DVD custa 2 CDs). Essa taxa de troca é determinada exclusivamente pelos preços relativos, independente do nível de renda.
Note 1.2: Fronteira de possibilidades de produção (FPP)
Desenvolvimento Teórico
Conceito
A Fronteira de Possibilidades de Produção (FPP) mostra todas as combinações de dois bens que podem ser produzidas quando os recursos disponíveis são utilizados de forma eficiente. A FPP é um dos conceitos mais fundamentais da economia, pois ilustra graficamente a noção de escassez e trade-off ao nível da sociedade (Perloff, 2022; Pindyck e Rubinfeld, 2013).
Formato côncavo e custo de oportunidade crescente
Na maioria dos casos, a FPP apresenta um formato côncavo em relação à origem. Isso ocorre porque os recursos não são perfeitamente adaptáveis à produção de ambos os bens. À medida que se transferem recursos da produção de um bem para outro, cada unidade adicional do segundo bem requer o sacrifício de quantidades cada vez maiores do primeiro. Isso é o custo de oportunidade crescente(Varian, 2012).
Regiões da FPP
Pontos sobre a fronteira: combinações eficientes — todos os recursos estão sendo utilizados plenamente.
Pontos dentro da fronteira: combinações ineficientes — há recursos ociosos ou mal alocados.
Pontos fora da fronteira: combinações inatingíveis — a economia não possui recursos suficientes para alcançá-las com a tecnologia atual.
Taxa Marginal de Transformação (TMT)
A Taxa Marginal de Transformação é a inclinação da FPP em cada ponto. Ela mede o custo de oportunidade na margem, ou seja, quantas unidades do bem \(Y\) devem ser sacrificadas para produzir uma unidade adicional do bem \(X\):
Em uma FPP côncava, a TMT é crescente: à medida que se produz mais do bem \(X\), o custo de oportunidade (em termos de \(Y\)) aumenta (Nicholson e Snyder, 2018).
Formalização Matemática
Modelo com custo de oportunidade crescente
Considere uma economia que produz dois bens: alimentos (\(A\)) e manufaturas (\(M\)). Se a FPP é descrita pela equação:
\[A^2 + M^2 = R^2\]
onde \(R\) representa a dotação total de recursos, então a fronteira é um quarto de círculo no primeiro quadrante.
A TMT é obtida por diferenciação implícita:
\[2A \, dA + 2M \, dM = 0\]
\[TMT = -\frac{dA}{dM} = \frac{M}{A}\]
Isso confirma o custo de oportunidade crescente: quando \(M\) é grande e \(A\) é pequeno (muita manufatura e pouco alimento), a TMT é alta — cada unidade adicional de manufatura custa muitas unidades de alimento.
Exemplo Numérico
Considere uma economia com a seguinte tabela de possibilidades de produção entre canhões e manteiga:
Combinação
Canhões
Manteiga (ton)
Custo de oportunidade (manteiga por canhão)
A
0
10
—
B
1
9
1
C
2
7
2
D
3
4
3
E
4
0
4
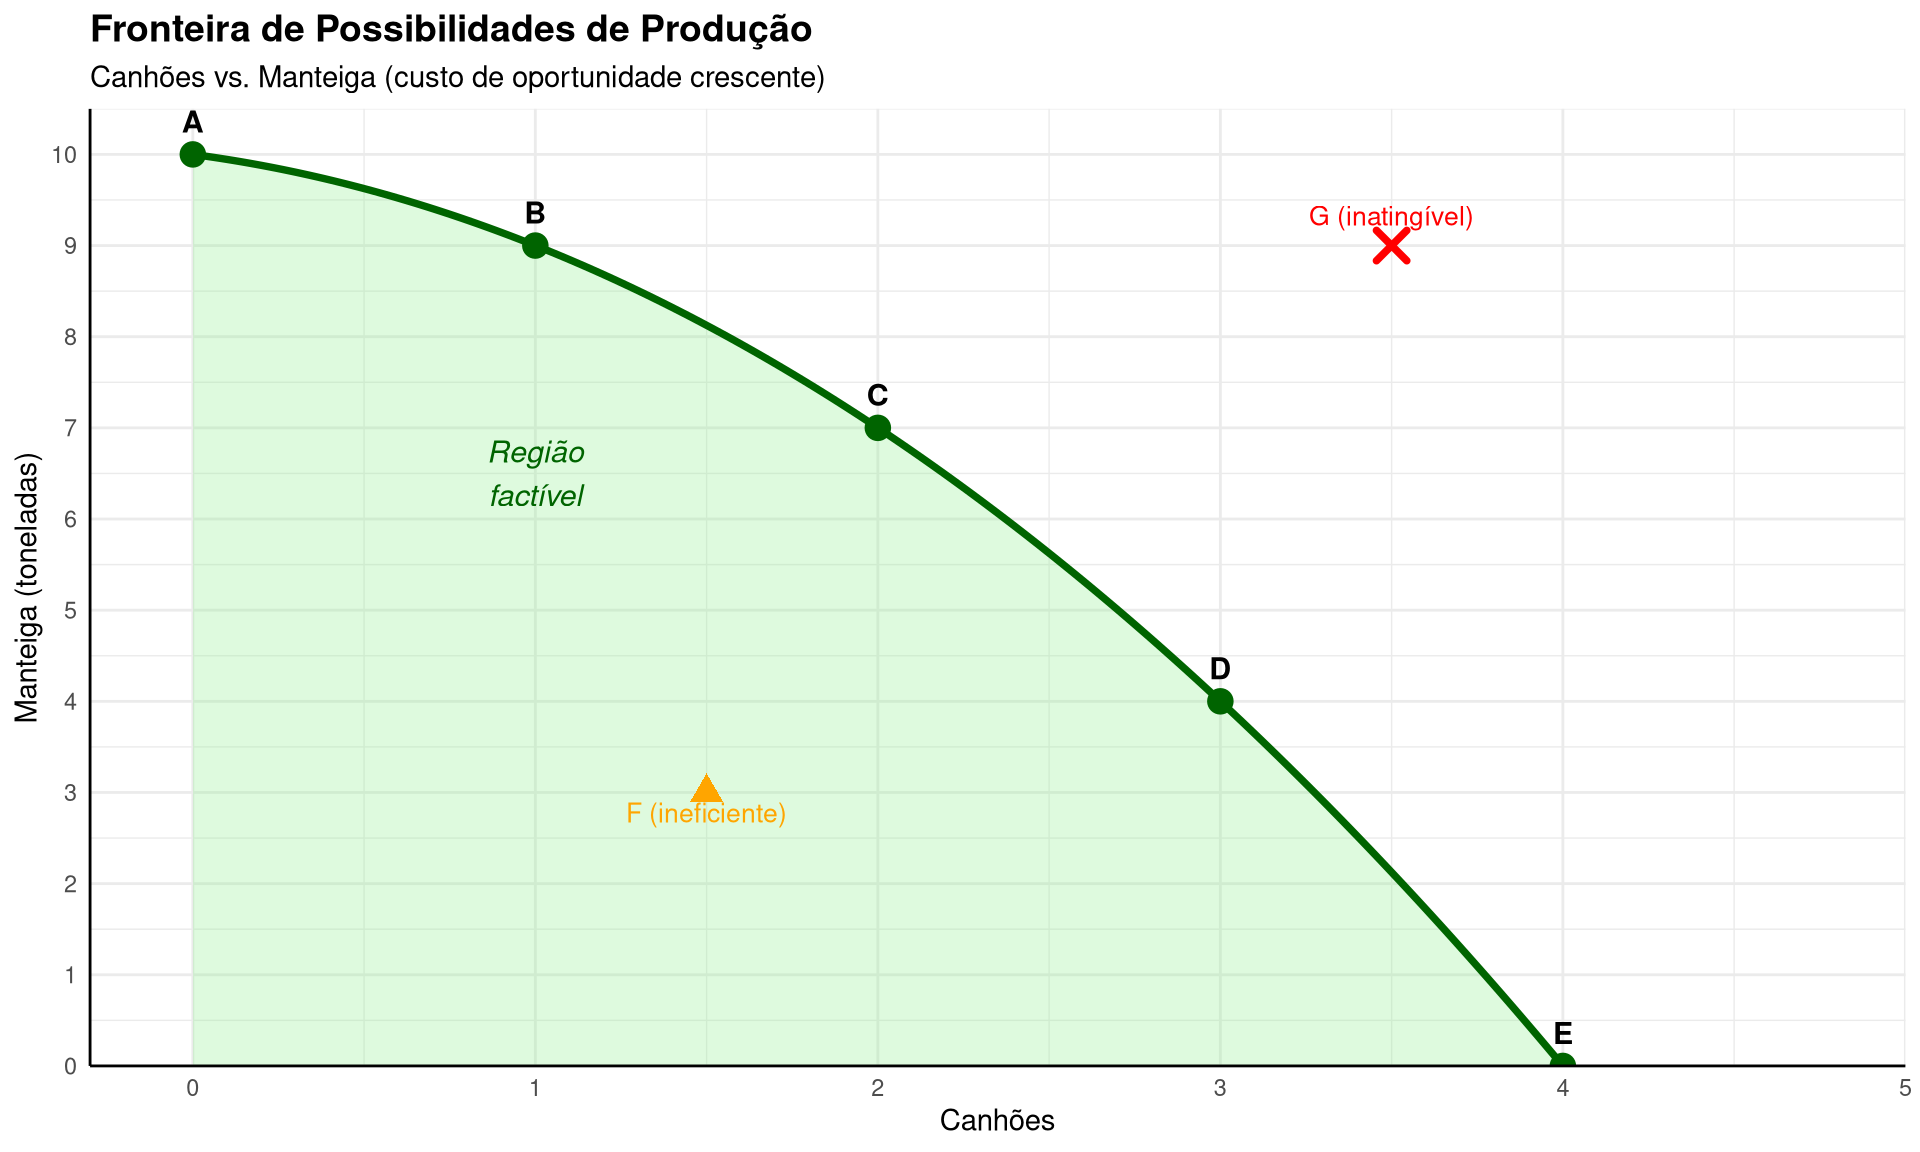
Observe que o custo de oportunidade é crescente: o primeiro canhão custa 1 tonelada de manteiga, o segundo custa 2, o terceiro custa 3, e o quarto custa 4. Isso ilustra o formato côncavo da FPP.
Implementação em R
Código
# Pontos da tabela de possibilidades de produçãofpp_pontos <- tibble::tibble(canhoes =c(0, 1, 2, 3, 4),manteiga =c(10, 9, 7, 4, 0),label =c("A", "B", "C", "D", "E"))# Curva suavizada para a FPP (spline passando pelos pontos da tabela)fpp_spline <-splinefun(fpp_pontos$canhoes, fpp_pontos$manteiga)fpp_curva <- tibble::tibble(canhoes =seq(0, 4, length.out =200),manteiga =fpp_spline(canhoes))# Ponto ineficiente e ponto inatingívelpontos_extra <- tibble::tibble(canhoes =c(1.5, 3.5),manteiga =c(3, 9),label =c("F (ineficiente)", "G (inatingível)"),tipo =c("ineficiente", "inatingível"))ggplot() +# Área sob a FPP (região factível)geom_ribbon(data = fpp_curva,aes(x = canhoes, ymin =0, ymax = manteiga),fill ="lightgreen",alpha =0.3 ) +# Curva FPPgeom_line(data = fpp_curva,aes(x = canhoes, y = manteiga),color ="darkgreen",linewidth =1.3 ) +# Pontos sobre a fronteirageom_point(data = fpp_pontos,aes(x = canhoes, y = manteiga),color ="darkgreen",size =4 ) +geom_text(data = fpp_pontos,aes(x = canhoes, y = manteiga, label = label),vjust =-1, hjust =0.5, fontface ="bold", size =4 ) +# Ponto ineficientegeom_point(data = pontos_extra |>filter(tipo =="ineficiente"),aes(x = canhoes, y = manteiga),color ="orange", size =4, shape =17 ) +geom_text(data = pontos_extra |>filter(tipo =="ineficiente"),aes(x = canhoes, y = manteiga, label = label),vjust =1.5, hjust =0.5, color ="orange", size =3.5 ) +# Ponto inatingívelgeom_point(data = pontos_extra |>filter(tipo =="inatingível"),aes(x = canhoes, y = manteiga),color ="red", size =4, shape =4, stroke =2 ) +geom_text(data = pontos_extra |>filter(tipo =="inatingível"),aes(x = canhoes, y = manteiga, label = label),vjust =-1, hjust =0.5, color ="red", size =3.5 ) +# Anotação da regiãoannotate("text", x =1, y =6.5,label ="Região\nfactível",size =4, color ="darkgreen", fontface ="italic" ) +labs(title ="Fronteira de Possibilidades de Produção",subtitle ="Canhões vs. Manteiga (custo de oportunidade crescente)",x ="Canhões",y ="Manteiga (toneladas)" ) +scale_x_continuous(breaks =0:5, limits =c(-0.3, 5), expand =c(0, 0)) +scale_y_continuous(breaks =seq(0, 11, by =1), limits =c(0, 10.5), expand =c(0, 0)) +theme_minimal() +theme(plot.title =element_text(size =14, face ="bold"),plot.subtitle =element_text(size =11),axis.line =element_line(color ="black", linewidth =0.5),axis.title =element_text(size =11) )
Interpretação
O gráfico ilustra os três conceitos fundamentais da FPP:
Eficiência: Os pontos A a E estão sobre a fronteira, representando combinações em que todos os recursos são utilizados plenamente. Não é possível aumentar a produção de um bem sem reduzir a do outro.
Ineficiência: O ponto F está dentro da fronteira, indicando que a economia poderia produzir mais de ambos os bens — há recursos ociosos ou mal alocados.
Inatingibilidade: O ponto G está fora da fronteira, representando uma combinação que a economia não pode alcançar com os recursos e a tecnologia disponíveis.
O formato côncavo da curva reflete o custo de oportunidade crescente: os primeiros canhões são “baratos” em termos de manteiga sacrificada, mas à medida que a produção de canhões aumenta, cada unidade adicional exige sacrificar quantidades cada vez maiores de manteiga. Isso ocorre porque os recursos mais adequados à produção de manteiga são os últimos a serem realocados para a produção de canhões.
Note 1.3: Modelo básico de concorrência perfeita
Desenvolvimento Teórico
Os três pilares do modelo
O modelo básico de concorrência perfeita é a referência central da análise microeconômica. Ele se sustenta em três requisitos fundamentais (Perloff, 2022; Pindyck e Rubinfeld, 2013):
Consumidores racionais: os consumidores são guiados pelo interesse próprio e buscam maximizar sua satisfação (utilidade), sujeitos à sua restrição orçamentária. Eles avaliam as alternativas disponíveis e escolhem aquela que lhes proporciona o maior bem-estar possível.
Firmas maximizadoras de lucro: as empresas buscam maximizar seus lucros, produzindo a quantidade na qual a receita marginal iguala o custo marginal. Elas tomam decisões racionais sobre quanto produzir e quais insumos utilizar.
Comportamento tomador de preço: tanto consumidores quanto firmas são tomadores de preço (price takers). Nenhum agente individual tem poder de mercado suficiente para influenciar o preço de mercado. O preço é determinado pela interação entre oferta e demanda agregadas.
Eficiência de Pareto
O modelo de concorrência perfeita conduz a uma alocação de recursos que é eficiente no sentido de Pareto: não é possível melhorar a situação de um agente sem piorar a de outro (Nicholson e Snyder, 2018; Varian, 2012).
Em uma alocação Pareto-eficiente:
Não há recursos desperdiçados.
Não é possível produzir mais de um bem sem reduzir a quantidade produzida de outro.
Não é possível redistribuir os bens entre os consumidores de forma a tornar alguém melhor sem tornar outro pior.
A Primeira Teoria do Bem-Estar (First Welfare Theorem) estabelece que, sob condições de concorrência perfeita, o equilíbrio de mercado é Pareto-eficiente.
O papel dos preços como sinais
As economias de mercado oferecem informação e incentivos por meio de três mecanismos centrais:
Preços: funcionam como sinais que coordenam as decisões descentralizadas de milhões de agentes. Quando um bem se torna relativamente escasso, seu preço sobe, sinalizando aos consumidores para reduzirem o consumo e aos produtores para aumentarem a oferta.
Lucros: motivam as firmas a produzir os bens mais valorizados pela sociedade. Para que o lucro seja uma motivação eficaz, as empresas precisam poder reter pelo menos parte de seus ganhos.
Direitos de propriedade: garantem que os agentes possam se apropriar dos frutos de suas decisões. Sem direitos de propriedade bem definidos, os incentivos de mercado são distorcidos.
Quando os direitos de propriedade falham
Quando os direitos de propriedade são mal definidos ou inexistentes, o mecanismo de mercado falha em produzir resultados eficientes. Dois exemplos clássicos:
Pesca em Grand Banks: como o estoque de peixes no oceano não pertence a ninguém, cada pescador tem incentivo individual para pescar o máximo possível — caso contrário, outro pescará. O resultado coletivo é a sobreexploração do recurso, que levou ao colapso dos estoques pesqueiros e à necessidade de acordos entre Estados Unidos e Canadá para regulamentar a pesca.
Água na Califórnia: fazendas têm o direito de usar a água a preços muito baixos, mas não podem vendê-la. Isso impede que a água flua para seus usos mais valiosos, gerando ineficiência na alocação do recurso.
Esses exemplos mostram que a eficiência do modelo de concorrência perfeita depende criticamente da existência de direitos de propriedade bem definidos e aplicáveis.
Conexão com o restante do curso
O modelo de concorrência perfeita serve como o benchmark teórico do curso. Nas próximas partes, estudaremos:
Partes 1 a 3: a teoria do consumidor e da firma sob concorrência perfeita.
Parte 4: estruturas de mercado que se desviam da concorrência perfeita (monopólio, oligopólio, concorrência monopolística).
Parte 5: equilíbrio geral e os teoremas do bem-estar.
Partes 6 e 7: falhas de mercado (externalidades, bens públicos, informação assimétrica) e mecanismos de regulação — situações em que o mercado não produz resultados eficientes e a intervenção pode ser justificada.
Interpretação
O modelo de concorrência perfeita, embora idealizado, fornece o ponto de partida indispensável para a análise econômica. Ele mostra como, sob certas condições, a busca descentralizada do interesse próprio pode levar a resultados socialmente eficientes — uma intuição que remonta à “mão invisível” de Adam Smith. Ao mesmo tempo, ao identificar claramente as condições necessárias para esse resultado (racionalidade, competição, direitos de propriedade), o modelo ilumina as circunstâncias em que essas condições não se sustentam e o mercado falha, abrindo espaço para a análise de políticas públicas e regulação.
Note 1.4: Curva de demanda e seus determinantes
Desenvolvimento Teórico
Lei da demanda
A curva de demanda mostra a relação entre o preço de um bem e a quantidade que os consumidores desejam adquirir, ceteris paribus. Na sua forma linear, a demanda é expressa como:
\[Q_d = a - bP\]
onde \(a > 0\) é o intercepto (quantidade demandada quando o preço é zero) e \(b > 0\) é a sensibilidade da quantidade ao preço. A lei da demanda estabelece que, tudo o mais constante, existe uma relação inversa entre preço e quantidade demandada: quando o preço sobe, a quantidade demandada cai, e vice-versa (Pindyck e Rubinfeld, 2013).
Determinantes da demanda
Além do preço do próprio bem, diversos fatores influenciam a posição da curva de demanda. Quando um desses fatores se altera, a curva inteira se desloca:
Renda dos consumidores: para bens normais, um aumento de renda desloca a demanda para a direita; para bens inferiores, para a esquerda.
Preços de bens substitutos: se o preço de um substituto sobe, a demanda pelo bem em questão aumenta (deslocamento para a direita).
Preços de bens complementares: se o preço de um complementar sobe, a demanda pelo bem diminui (deslocamento para a esquerda).
Preferências e gostos: mudanças nas preferências dos consumidores deslocam a curva de demanda.
Expectativas: expectativas sobre preços futuros ou renda futura afetam as decisões de consumo presentes.
Número de consumidores: um aumento no número de consumidores no mercado desloca a demanda agregada para a direita.
Movimento ao longo da curva vs. deslocamento da curva
É fundamental distinguir entre:
Movimento ao longo da curva de demanda: ocorre quando o preço do próprio bem se altera, mantendo todos os outros fatores constantes. Representa uma mudança na quantidade demandada.
Deslocamento da curva de demanda: ocorre quando um dos determinantes (renda, preços de outros bens, preferências, etc.) se altera. Representa uma mudança na demanda como um todo.
Exemplo Resolvido
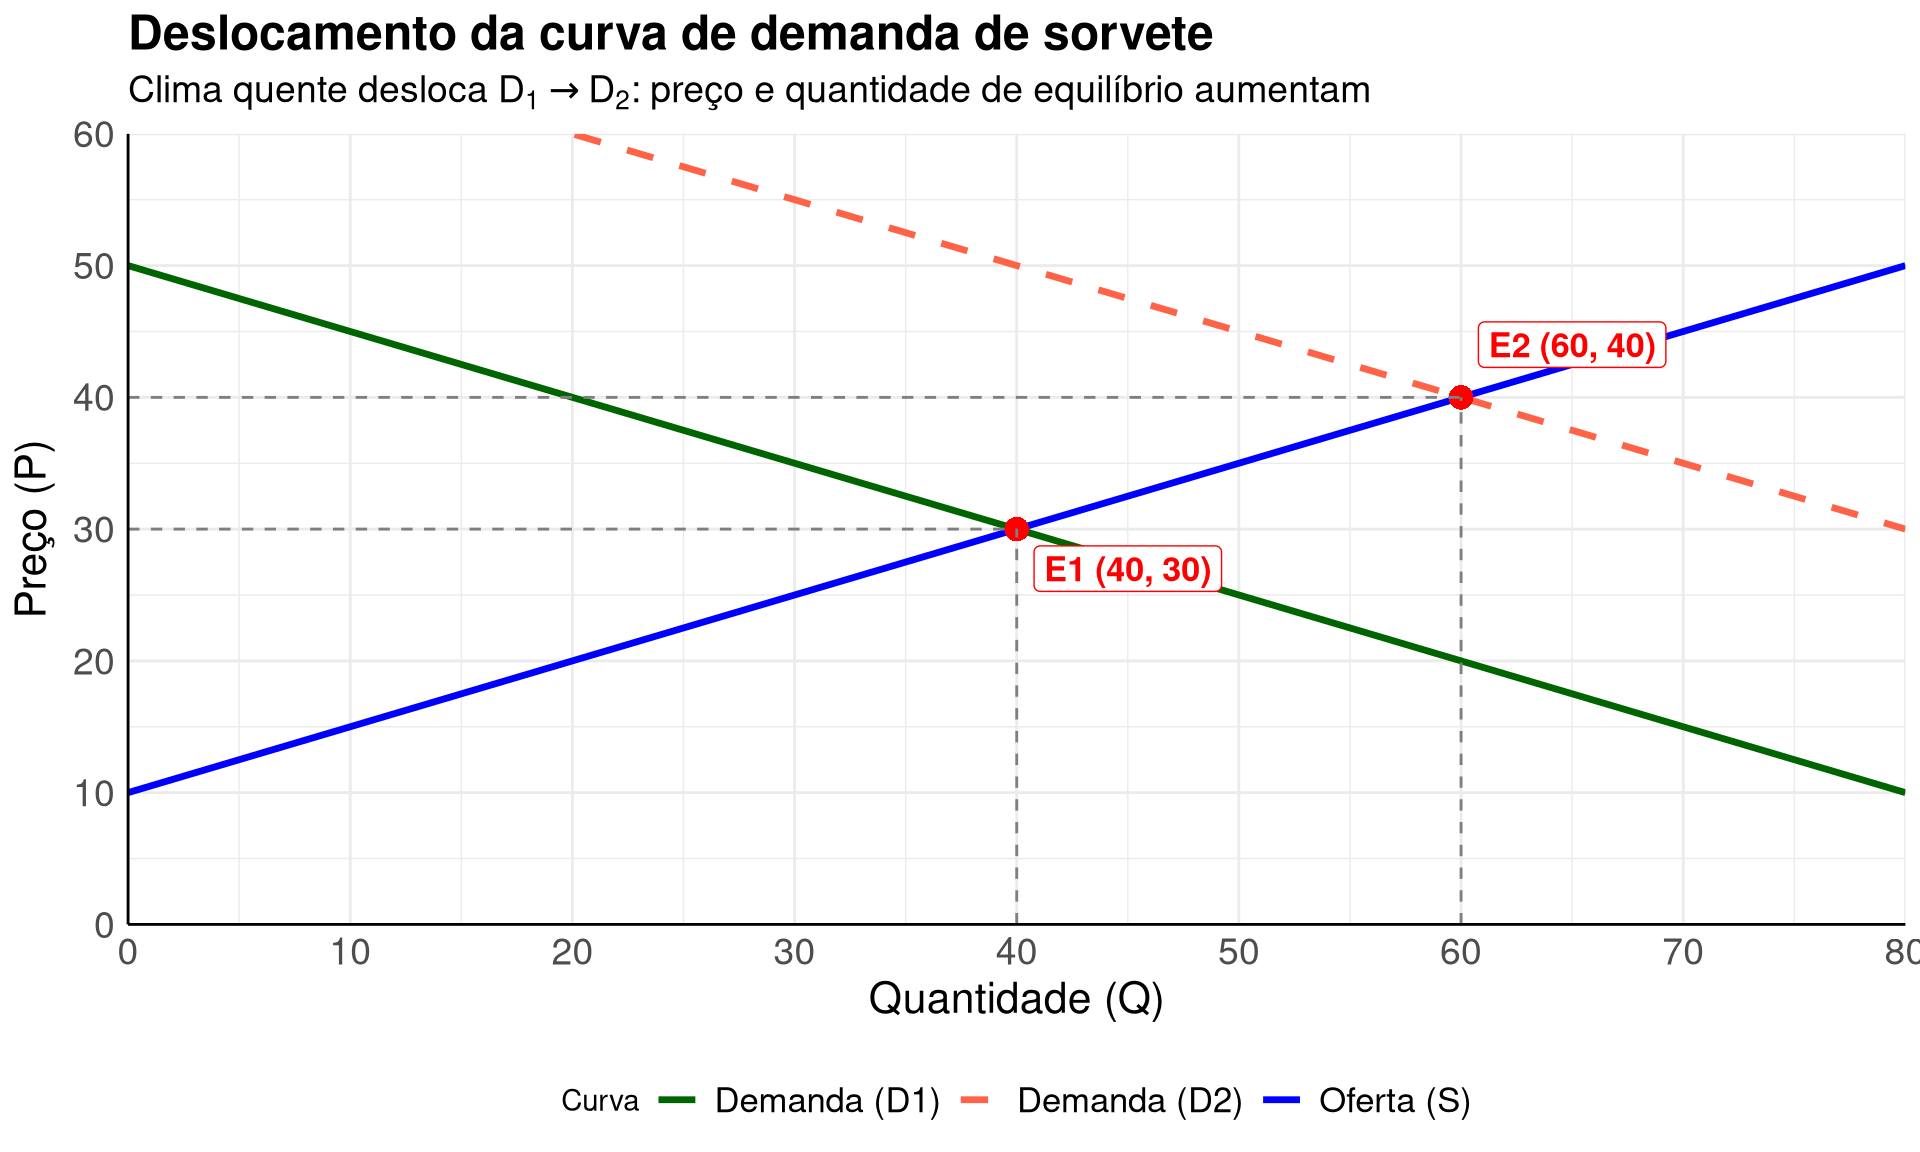
Problema(Pindyck e Rubinfeld, 2013): Suponha que um clima excepcionalmente quente ocasione um deslocamento para a direita na curva da demanda de sorvete. Por que razão o preço de equilíbrio do sorvete aumentaria?
Resposta: O clima excepcionalmente quente altera as preferências dos consumidores, aumentando o desejo por sorvete a qualquer nível de preço. Isso desloca a curva de demanda para a direita (de \(D_1\) para \(D_2\)). Supondo que a curva de oferta se mantenha inalterada, o deslocamento da demanda gera, no curto prazo, um excesso de demanda ao preço vigente (\(P_1\)). Os consumidores competem entre si pelo sorvete, pressionando o preço para cima. O preço sobe até que a quantidade demandada e a quantidade ofertada se igualem no novo equilíbrio (\(E_2\)), com preço e quantidade maiores do que no equilíbrio original (\(E_1\)) (Perloff, 2022).
Implementação em R
Código
suppressPackageStartupMessages({library(ggplot2)library(dplyr)library(latex2exp)})# Parâmetros das curvas# Oferta: Qs = -20 + 2P => P = (Q + 20) / 2# Demanda original (D1): Qd = 100 - 2P => P = (100 - Q) / 2# Demanda deslocada (D2): Qd = 140 - 2P => P = (140 - Q) / 2q_seq <-seq(0, 80, length.out =200)# Preços inversosp_oferta <- (q_seq +20) /2p_demanda1 <- (100- q_seq) /2p_demanda2 <- (140- q_seq) /2# Equilíbrio E1: 100 - 2P = -20 + 2P => 120 = 4P => P = 30, Q = 40p_eq1 <-30q_eq1 <-40# Equilíbrio E2: 140 - 2P = -20 + 2P => 160 = 4P => P = 40, Q = 60p_eq2 <-40q_eq2 <-60dados_curvas <- tibble::tibble(Q =rep(q_seq, 3),P =c(p_oferta, p_demanda1, p_demanda2),Curva =rep(c("Oferta (S)", "Demanda (D1)", "Demanda (D2)"), each =length(q_seq))) |> dplyr::filter(P >=0, P <=60, Q >=0)pontos_eq <- tibble::tibble(Q =c(q_eq1, q_eq2),P =c(p_eq1, p_eq2),label =c("E1", "E2"))ggplot() +geom_line(data = dados_curvas,aes(x = Q, y = P, color = Curva, linetype = Curva),linewidth =1.2 ) +geom_point(data = pontos_eq,aes(x = Q, y = P),color ="red", size =4, shape =16 ) +# Linhas tracejadas para E1geom_segment(aes(x = q_eq1, xend = q_eq1, y =0, yend = p_eq1),linetype ="dashed", color ="gray50" ) +geom_segment(aes(x =0, xend = q_eq1, y = p_eq1, yend = p_eq1),linetype ="dashed", color ="gray50" ) +# Linhas tracejadas para E2geom_segment(aes(x = q_eq2, xend = q_eq2, y =0, yend = p_eq2),linetype ="dashed", color ="gray50" ) +geom_segment(aes(x =0, xend = q_eq2, y = p_eq2, yend = p_eq2),linetype ="dashed", color ="gray50" ) +# Rótulos dos equilíbrios (com caixa de fundo)annotate("label", x = q_eq1 +5, y = p_eq1 -3,label =paste0("E1 (", q_eq1, ", ", p_eq1, ")"),color ="red", fontface ="bold", size =4.5,fill ="white", label.size =0.3 ) +annotate("label", x = q_eq2 +5, y = p_eq2 +4,label =paste0("E2 (", q_eq2, ", ", p_eq2, ")"),color ="red", fontface ="bold", size =4.5,fill ="white", label.size =0.3 ) +scale_color_manual(values =c("Oferta (S)"="blue", "Demanda (D1)"="darkgreen", "Demanda (D2)"="tomato") ) +scale_linetype_manual(values =c("Oferta (S)"="solid", "Demanda (D1)"="solid", "Demanda (D2)"="dashed") ) +labs(title ="Deslocamento da curva de demanda de sorvete",subtitle =TeX(r"(Clima quente desloca $D_1 \rightarrow D_2$: preço e quantidade de equilíbrio aumentam)"),x =TeX(r"(Quantidade ($Q$))"),y =TeX(r"(Preço ($P$))"),color ="Curva",linetype ="Curva" ) +scale_x_continuous(breaks =seq(0, 80, by =10), limits =c(0, 80), expand =c(0, 0)) +scale_y_continuous(breaks =seq(0, 60, by =10), limits =c(0, 60), expand =c(0, 0)) +theme_minimal() +theme(plot.title =element_text(size =18, face ="bold"),plot.subtitle =element_text(size =14),axis.line =element_line(color ="black", linewidth =0.5),axis.title =element_text(size =16, face ="bold"),axis.text =element_text(size =14),legend.position ="bottom",legend.text =element_text(size =13) )
Interpretação
O gráfico ilustra o efeito de um deslocamento da curva de demanda sobre o equilíbrio de mercado. A curva de oferta \(S\) permanece fixa, enquanto a demanda se desloca de \(D_1\) para \(D_2\) devido ao clima quente. No equilíbrio original \(E_1\), o preço é \(P_1 = 30\) e a quantidade é \(Q_1 = 40\). Com o deslocamento, o novo equilíbrio \(E_2\) apresenta preço mais alto (\(P_2 = 40\)) e quantidade maior (\(Q_2 = 60\)). Isso ocorre porque, ao preço antigo, a quantidade demandada excede a ofertada, criando pressão para elevação do preço até que o mercado se reequilibre.
Note 1.5: Curva de oferta e seus determinantes
Desenvolvimento Teórico
A curva de oferta
A curva de oferta mostra a relação entre o preço de um bem e a quantidade que os produtores desejam vender, ceteris paribus. Na sua forma linear, a oferta é expressa como:
\[Q_s = c + dP\]
onde \(c\) é o intercepto (que pode ser negativo, indicando um preço mínimo para que a produção ocorra) e \(d > 0\) reflete a sensibilidade da quantidade ofertada ao preço. Diferentemente da demanda, a oferta apresenta uma relação direta (positiva) entre preço e quantidade: quando o preço sobe, a quantidade ofertada aumenta, pois torna-se mais lucrativo produzir (Pindyck e Rubinfeld, 2013).
Determinantes da oferta
Os seguintes fatores deslocam a curva de oferta quando se alteram:
Custos dos insumos: aumento nos custos de matérias-primas, mão de obra ou energia desloca a oferta para a esquerda (reduz a oferta).
Tecnologia: inovações tecnológicas que aumentam a produtividade deslocam a oferta para a direita.
Número de firmas: a entrada de novas firmas no mercado aumenta a oferta agregada.
Expectativas: expectativas sobre preços futuros podem levar firmas a ajustar sua produção presente.
Preços de bens relacionados na produção: se uma firma pode produzir diferentes bens com os mesmos recursos, um aumento no preço de um bem alternativo pode reduzir a oferta do bem em questão.
Exemplo Resolvido
Problema(Pindyck e Rubinfeld, 2013): Utilize as curvas da oferta e da demanda para ilustrar de que forma cada um dos seguintes fatos afetaria o preço e a quantidade de manteiga comprada e vendida:
Caso a: aumento no preço da margarina
A maioria das pessoas considera a manteiga e a margarina bens substitutos no consumo. Um aumento do preço da margarina torna a manteiga relativamente mais atrativa, deslocando a curva da demanda de manteiga para a direita (de \(D_1\) para \(D_2\)). Com a oferta inalterada, o resultado é um aumento tanto no preço de equilíbrio (de \(P_1\) para \(P_2\)) quanto na quantidade de equilíbrio (de \(Q_1\) para \(Q_2\)).
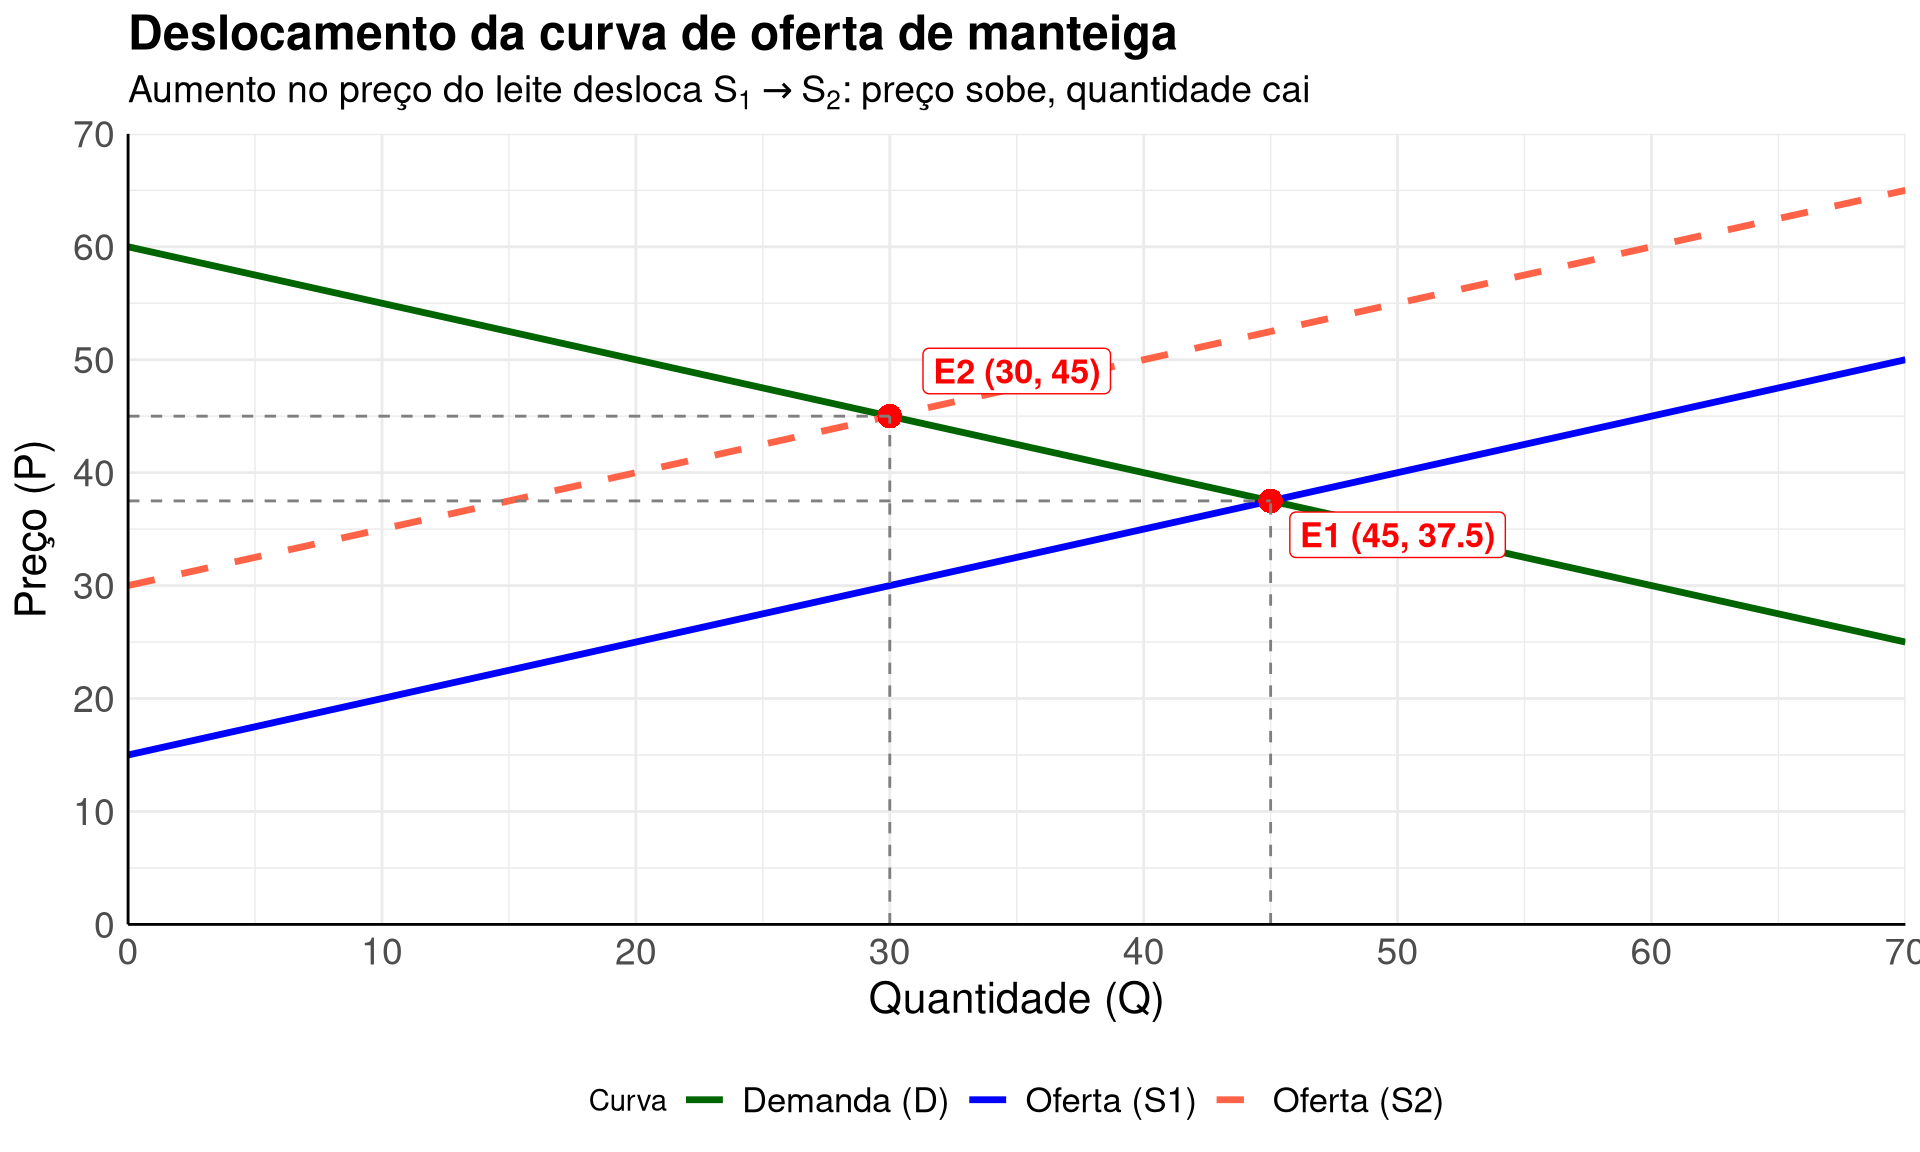
Caso b: aumento no preço do leite
O leite é o principal insumo na fabricação da manteiga. Um aumento do preço do leite eleva o custo de produção da manteiga, deslocando a curva da oferta para a esquerda (de \(S_1\) para \(S_2\)). Com a demanda inalterada, o resultado é um preço de equilíbrio mais alto (\(P_2 > P_1\)) e uma quantidade de equilíbrio menor (\(Q_2 < Q_1\)).
Observação importante: dado que a manteiga é produzida a partir da gordura extraída do leite, a manteiga e o leite são, na verdade, produtos complementares na produção (produção conjunta). Levando em consideração essa relação, a resposta pode ser diferente: à medida que o preço do leite aumenta, a quantidade ofertada de leite também aumenta. O aumento na quantidade ofertada de leite implica maior disponibilidade de gordura para a produção de manteiga, o que poderia deslocar a oferta de manteiga para a direita, reduzindo o preço da manteiga — resultado oposto ao esperado pela análise convencional de custos.
Implementação em R
Código
suppressPackageStartupMessages({library(ggplot2)library(dplyr)library(latex2exp)})# Caso b: Deslocamento da oferta de manteiga para a esquerda# Oferta original (S1): Qs = -30 + 2P => P = (Q + 30) / 2# Oferta deslocada (S2): Qs = -60 + 2P => P = (Q + 60) / 2# Demanda: Qd = 120 - 2P => P = (120 - Q) / 2q_seq <-seq(0, 70, length.out =200)p_oferta1 <- (q_seq +30) /2p_oferta2 <- (q_seq +60) /2p_demanda <- (120- q_seq) /2# Equilíbrio E1: 120 - 2P = -30 + 2P => 150 = 4P => P = 37.5, Q = 45p_eq1 <-37.5q_eq1 <-45# Equilíbrio E2: 120 - 2P = -60 + 2P => 180 = 4P => P = 45, Q = 30p_eq2 <-45q_eq2 <-30dados_curvas <- tibble::tibble(Q =rep(q_seq, 3),P =c(p_oferta1, p_oferta2, p_demanda),Curva =rep(c("Oferta (S1)", "Oferta (S2)", "Demanda (D)"), each =length(q_seq))) |> dplyr::filter(P >=0, P <=70, Q >=0)pontos_eq <- tibble::tibble(Q =c(q_eq1, q_eq2),P =c(p_eq1, p_eq2),label =c("E1", "E2"))ggplot() +geom_line(data = dados_curvas,aes(x = Q, y = P, color = Curva, linetype = Curva),linewidth =1.2 ) +geom_point(data = pontos_eq,aes(x = Q, y = P),color ="red", size =4, shape =16 ) +# Linhas tracejadas para E1geom_segment(aes(x = q_eq1, xend = q_eq1, y =0, yend = p_eq1),linetype ="dashed", color ="gray50" ) +geom_segment(aes(x =0, xend = q_eq1, y = p_eq1, yend = p_eq1),linetype ="dashed", color ="gray50" ) +# Linhas tracejadas para E2geom_segment(aes(x = q_eq2, xend = q_eq2, y =0, yend = p_eq2),linetype ="dashed", color ="gray50" ) +geom_segment(aes(x =0, xend = q_eq2, y = p_eq2, yend = p_eq2),linetype ="dashed", color ="gray50" ) +# Rótulos dos equilíbrios (com caixa de fundo)annotate("label", x = q_eq1 +5, y = p_eq1 -3,label =paste0("E1 (", q_eq1, ", ", p_eq1, ")"),color ="red", fontface ="bold", size =4.5,fill ="white", label.size =0.3 ) +annotate("label", x = q_eq2 +5, y = p_eq2 +4,label =paste0("E2 (", q_eq2, ", ", p_eq2, ")"),color ="red", fontface ="bold", size =4.5,fill ="white", label.size =0.3 ) +scale_color_manual(values =c("Oferta (S1)"="blue", "Oferta (S2)"="tomato", "Demanda (D)"="darkgreen") ) +scale_linetype_manual(values =c("Oferta (S1)"="solid", "Oferta (S2)"="dashed", "Demanda (D)"="solid") ) +labs(title ="Deslocamento da curva de oferta de manteiga",subtitle =TeX(r"(Aumento no preço do leite desloca $S_1 \rightarrow S_2$: preço sobe, quantidade cai)"),x =TeX(r"(Quantidade ($Q$))"),y =TeX(r"(Preço ($P$))"),color ="Curva",linetype ="Curva" ) +scale_x_continuous(breaks =seq(0, 70, by =10), limits =c(0, 70), expand =c(0, 0)) +scale_y_continuous(breaks =seq(0, 70, by =10), limits =c(0, 70), expand =c(0, 0)) +theme_minimal() +theme(plot.title =element_text(size =18, face ="bold"),plot.subtitle =element_text(size =14),axis.line =element_line(color ="black", linewidth =0.5),axis.title =element_text(size =16, face ="bold"),axis.text =element_text(size =14),legend.position ="bottom",legend.text =element_text(size =13) )
Interpretação
O gráfico ilustra o caso b: o aumento no preço do leite eleva os custos de produção da manteiga, deslocando a curva de oferta de \(S_1\) para \(S_2\). Com a demanda inalterada, o novo equilíbrio \(E_2\) apresenta preço mais alto e quantidade menor que o equilíbrio original \(E_1\). Isso demonstra que um choque negativo de oferta (aumento de custos) gera simultaneamente elevação de preço e queda na quantidade transacionada. A observação sobre a complementaridade na produção entre leite e manteiga alerta para a importância de compreender a estrutura produtiva completa antes de aplicar mecanicamente os modelos de oferta e demanda.
Note 1.6: Equilíbrio de mercado
Desenvolvimento Teórico
Conceito de equilíbrio
O equilíbrio de mercado ocorre quando a quantidade demandada iguala a quantidade ofertada a um determinado preço. Formalmente, é o preço \(P^*\) tal que:
\[Q_d(P^*) = Q_s(P^*)\]
Nesse ponto, não há pressão para que o preço se altere: todos os consumidores dispostos a comprar ao preço \(P^*\) encontram vendedores, e todos os vendedores dispostos a vender a esse preço encontram compradores (Perloff, 2022; Pindyck e Rubinfeld, 2013).
Excesso de demanda e excesso de oferta
Quando o preço de mercado difere do preço de equilíbrio, surgem desequilíbrios:
Excesso de demanda (ou escassez): quando \(P < P^*\), a quantidade demandada excede a ofertada (\(Q_d > Q_s\)). Os consumidores competem pelo bem, pressionando o preço para cima.
Excesso de oferta (ou excedente): quando \(P > P^*\), a quantidade ofertada excede a demandada (\(Q_s > Q_d\)). Os produtores competem por compradores, pressionando o preço para baixo.
Em ambos os casos, as forças de mercado tendem a conduzir o preço de volta ao equilíbrio.
Formalização Matemática
Resolução algébrica
Para curvas lineares de demanda e oferta, o equilíbrio é encontrado igualando-se as duas equações e resolvendo para \(P\):
\[Q_d = a - bP \quad \text{e} \quad Q_s = c + dP\]
No equilíbrio: \(a - bP^* = c + dP^*\)
\[P^* = \frac{a - c}{b + d}\]
\[Q^* = c + d \cdot P^* = c + d \cdot \frac{a - c}{b + d}\]
Exercício Resolvido
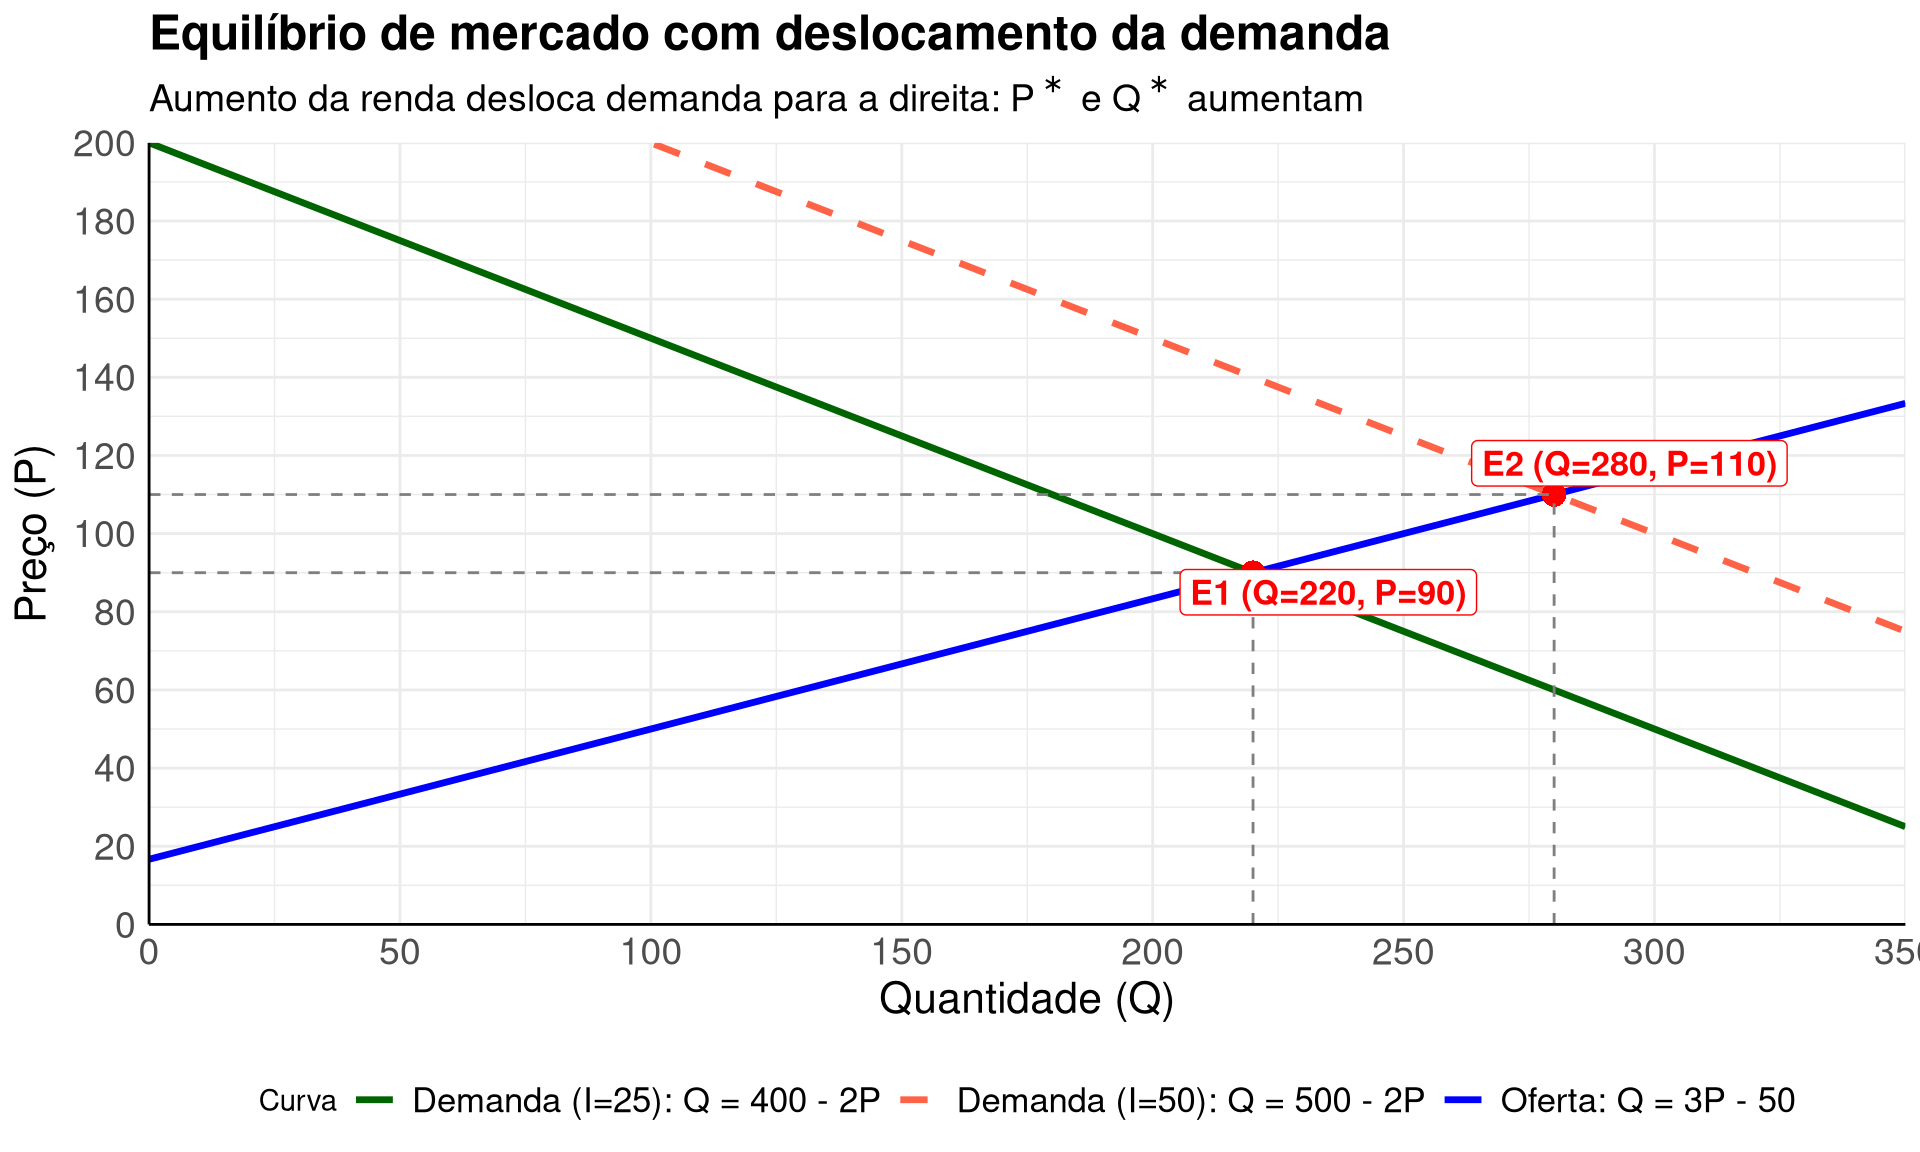
Problema(Pindyck e Rubinfeld, 2013): Suponha que a curva da demanda por um produto seja dada por \(Q = 300 - 2P + 4I\), onde \(I\) é a renda média medida em milhares de reais. A curva da oferta é \(Q = 3P - 50\).
Interpretação: o aumento da renda de \(I = 25\) para \(I = 50\) desloca a curva de demanda para a direita (de \(Q = 400 - 2P\) para \(Q = 500 - 2P\)), elevando tanto o preço de equilíbrio (de 90 para 110) quanto a quantidade de equilíbrio (de 220 para 280). Isso ocorre porque o bem em questão é um bem normal — sua demanda cresce com a renda.
Tabela de análise de sensibilidade (Caso a: \(I = 25\))
Preço (\(P\))
\(Q_d = 400 - 2P\)
\(Q_s = 3P - 50\)
Excesso de demanda (\(Q_d - Q_s\))
Situação
50
300
100
+200
Escassez
70
260
160
+100
Escassez
80
240
190
+50
Escassez
90
220
220
0
Equilíbrio
100
200
250
-50
Excedente
110
180
280
-100
Excedente
130
140
340
-200
Excedente
Implementação em R
Código
suppressPackageStartupMessages({library(ggplot2)library(dplyr)library(latex2exp)})# Funções de oferta e demanda# Oferta: Q = 3P - 50 => P = (Q + 50) / 3# Demanda (I=25): Q = 400 - 2P => P = (400 - Q) / 2# Demanda (I=50): Q = 500 - 2P => P = (500 - Q) / 2# Gerar sequência de quantidadesq_seq <-seq(0, 350, length.out =300)# Preço como função inversa de Qp_oferta <- (q_seq +50) /3p_demanda_25 <- (400- q_seq) /2p_demanda_50 <- (500- q_seq) /2# Equilíbrio E1 (I=25): P* = 90, Q* = 220p_eq1 <-90q_eq1 <-220# Equilíbrio E2 (I=50): P* = 110, Q* = 280p_eq2 <-110q_eq2 <-280# Montar dados para o gráficodados_curvas <- tibble::tibble(Q =rep(q_seq, 3),P =c(p_oferta, p_demanda_25, p_demanda_50),Curva =rep(c("Oferta: Q = 3P - 50","Demanda (I=25): Q = 400 - 2P","Demanda (I=50): Q = 500 - 2P"),each =length(q_seq) )) |> dplyr::filter(P >=0, P <=200, Q >=0)pontos_eq <- tibble::tibble(Q =c(q_eq1, q_eq2),P =c(p_eq1, p_eq2),label =c("E1", "E2"))ggplot() +geom_line(data = dados_curvas,aes(x = Q, y = P, color = Curva, linetype = Curva),linewidth =1.2 ) +geom_point(data = pontos_eq,aes(x = Q, y = P),color ="red", size =4, shape =16 ) +# Linhas tracejadas para E1geom_segment(aes(x = q_eq1, xend = q_eq1, y =0, yend = p_eq1),linetype ="dashed", color ="gray50" ) +geom_segment(aes(x =0, xend = q_eq1, y = p_eq1, yend = p_eq1),linetype ="dashed", color ="gray50" ) +# Linhas tracejadas para E2geom_segment(aes(x = q_eq2, xend = q_eq2, y =0, yend = p_eq2),linetype ="dashed", color ="gray50" ) +geom_segment(aes(x =0, xend = q_eq2, y = p_eq2, yend = p_eq2),linetype ="dashed", color ="gray50" ) +# Rótulos dos equilíbrios (com caixa de fundo)annotate("label", x = q_eq1 +15, y = p_eq1 -5,label =paste0("E1 (Q=", q_eq1, ", P=", p_eq1, ")"),color ="red", fontface ="bold", size =4.5,fill ="white", label.size =0.3 ) +annotate("label", x = q_eq2 +15, y = p_eq2 +8,label =paste0("E2 (Q=", q_eq2, ", P=", p_eq2, ")"),color ="red", fontface ="bold", size =4.5,fill ="white", label.size =0.3 ) +scale_color_manual(values =c("Oferta: Q = 3P - 50"="blue","Demanda (I=25): Q = 400 - 2P"="darkgreen","Demanda (I=50): Q = 500 - 2P"="tomato" ) ) +scale_linetype_manual(values =c("Oferta: Q = 3P - 50"="solid","Demanda (I=25): Q = 400 - 2P"="solid","Demanda (I=50): Q = 500 - 2P"="dashed" ) ) +labs(title ="Equilíbrio de mercado com deslocamento da demanda",subtitle =TeX(r"(Aumento da renda desloca demanda para a direita: $P^*$ e $Q^*$ aumentam)"),x =TeX(r"(Quantidade ($Q$))"),y =TeX(r"(Preço ($P$))"),color ="Curva",linetype ="Curva" ) +scale_x_continuous(breaks =seq(0, 350, by =50), limits =c(0, 350), expand =c(0, 0)) +scale_y_continuous(breaks =seq(0, 200, by =20), limits =c(0, 200), expand =c(0, 0)) +theme_minimal() +theme(plot.title =element_text(size =18, face ="bold"),plot.subtitle =element_text(size =14),axis.line =element_line(color ="black", linewidth =0.5),axis.title =element_text(size =16, face ="bold"),axis.text =element_text(size =14),legend.position ="bottom",legend.text =element_text(size =13) )
Interpretação
O gráfico mostra como o aumento da renda média dos consumidores afeta o equilíbrio de mercado. A curva de oferta (em azul) permanece fixa, enquanto a curva de demanda se desloca para a direita quando a renda aumenta de \(I = 25\) para \(I = 50\). O equilíbrio move-se de \(E_1\) (\(P^* = 90\), \(Q^* = 220\)) para \(E_2\) (\(P^* = 110\), \(Q^* = 280\)).
A tabela de análise de sensibilidade mostra que, para preços abaixo do equilíbrio (\(P < 90\)), há excesso de demanda (escassez), que pressiona o preço para cima. Para preços acima do equilíbrio (\(P > 90\)), há excesso de oferta (excedente), que pressiona o preço para baixo. Apenas no preço de equilíbrio as quantidades demandada e ofertada se igualam, eliminando qualquer pressão sobre o preço.
Note 1.7: Estática comparativa
Desenvolvimento Teórico
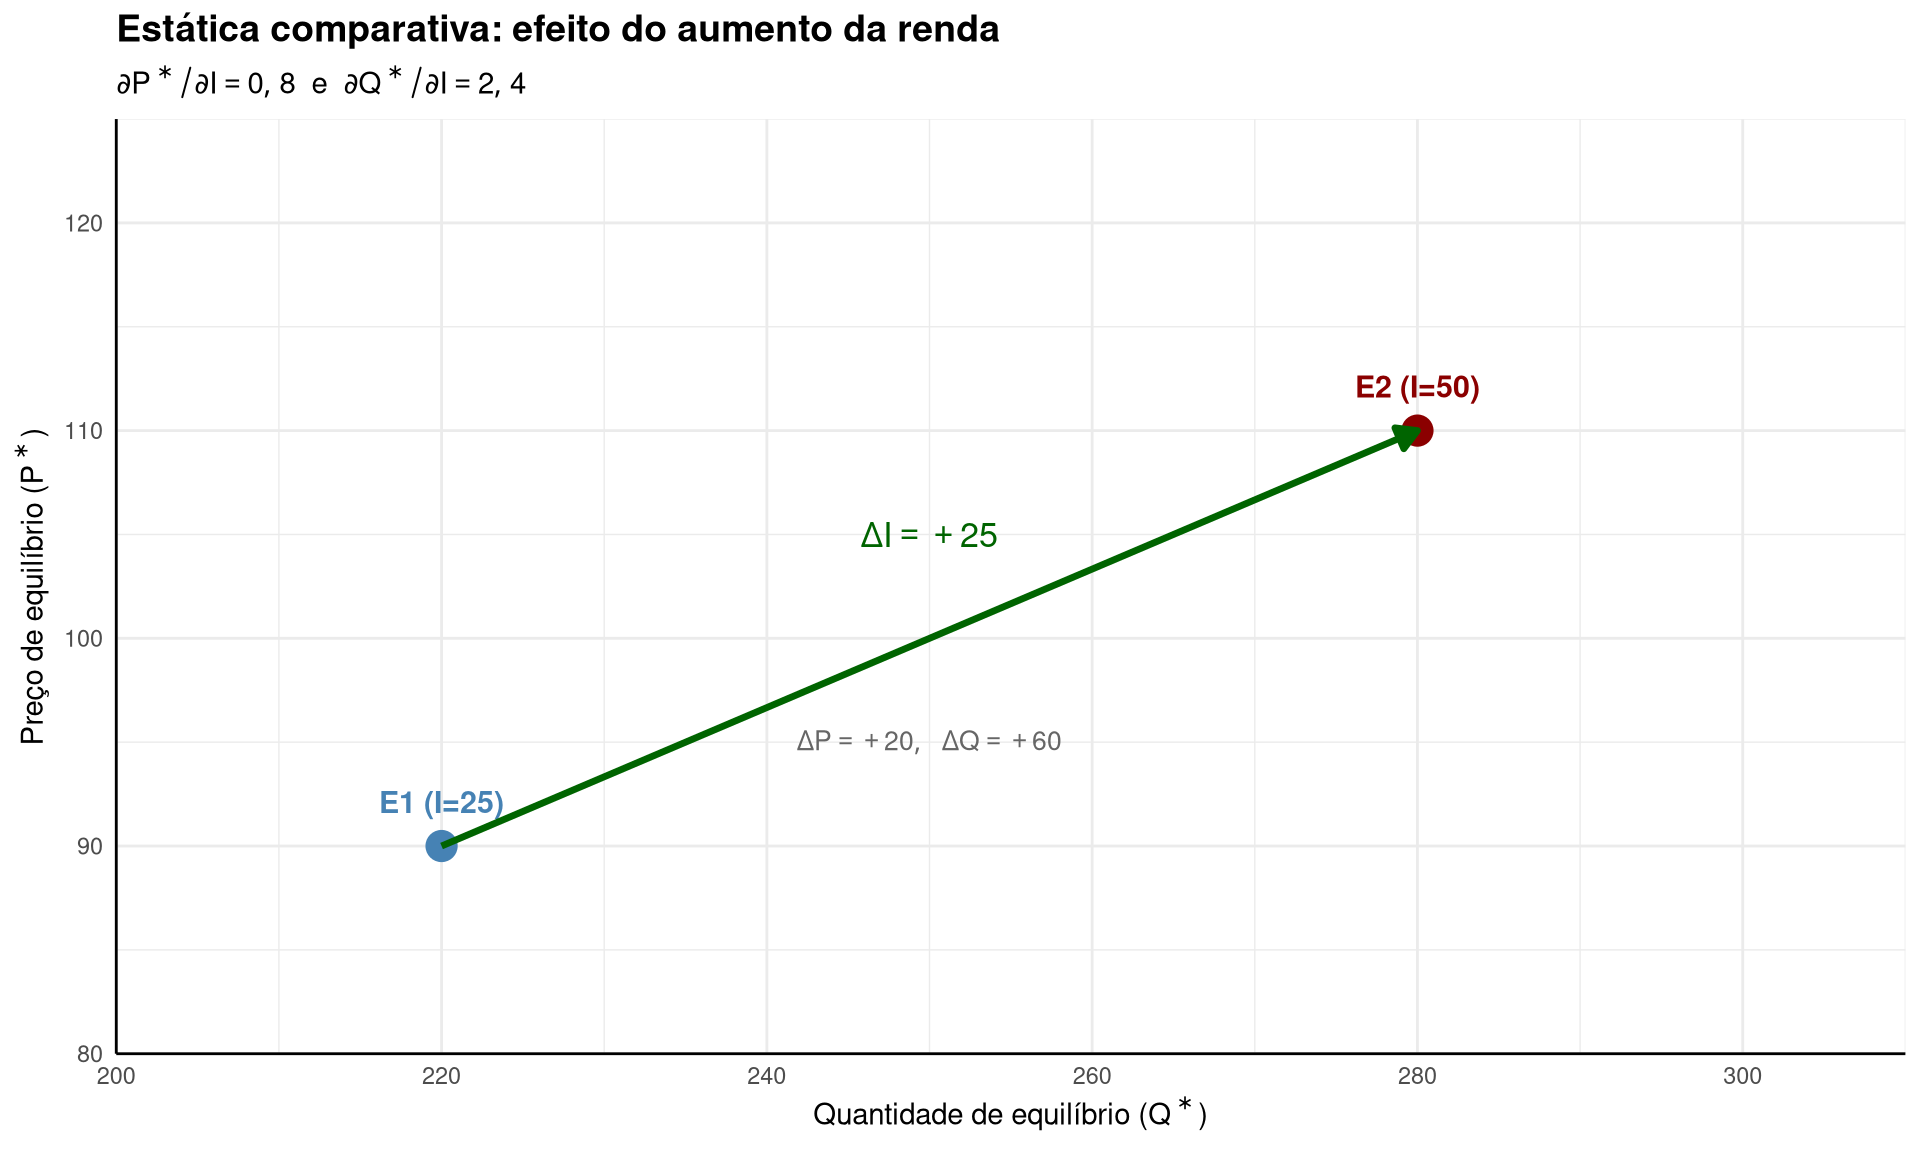
A estática comparativa compara dois equilíbrios — antes e depois de uma mudança exógena. Não analisa o processo de ajuste, apenas os estados inicial e final. É uma das ferramentas mais utilizadas na análise econômica, pois permite prever a direção e a magnitude das mudanças nos preços e quantidades de equilíbrio quando um parâmetro exógeno se altera (Nicholson e Snyder, 2018; Perloff, 2022).
Formalização Matemática
Utilizamos o sistema do callout anterior, com renda (\(I\)) como variável exógena:
Demanda:\(Q = 300 - 2P + 4I\)
Oferta:\(Q = 3P - 50\)
Solução geral: igualando oferta e demanda:
\[300 - 2P + 4I = 3P - 50\]
\[350 + 4I = 5P\]
\[P^* = \frac{350 + 4I}{5} = 70 + \frac{4I}{5}\]
A quantidade de equilíbrio é obtida substituindo \(P^*\) na equação de oferta:
A quantidade de equilíbrio também aumenta com a renda: para cada unidade adicional de renda, a quantidade cresce em 2,4 unidades.
Exemplo Numérico
Variável
\(I = 25\)
\(I = 50\)
Variação
\(P^*\)
\(70 + \frac{4 \times 25}{5} = 90\)
\(70 + \frac{4 \times 50}{5} = 110\)
\(+20\)
\(Q^*\)
\(160 + \frac{12 \times 25}{5} = 220\)
\(160 + \frac{12 \times 50}{5} = 280\)
\(+60\)
Implementação em R
Código
suppressPackageStartupMessages({library(ggplot2)library(dplyr)library(latex2exp)})# Funções de equilíbriop_star <-function(I) 70+4* I /5q_star <-function(I) 160+12* I /5# Dois cenáriosI1 <-25I2 <-50P1 <-p_star(I1) # 90Q1 <-q_star(I1) # 220P2 <-p_star(I2) # 110Q2 <-q_star(I2) # 280# Dados para o gráficopontos_eq <- tibble::tibble(label =c("E1 (I=25)", "E2 (I=50)"),Q =c(Q1, Q2),P =c(P1, P2))ggplot(pontos_eq, aes(x = Q, y = P)) +geom_point(size =5, color =c("steelblue", "darkred")) +geom_text(aes(label = label),vjust =-1.5, size =4, fontface ="bold",color =c("steelblue", "darkred") ) +annotate("segment",x = Q1, xend = Q2,y = P1, yend = P2,arrow =arrow(length =unit(0.3, "cm"), type ="closed"),color ="darkgreen", linewidth =1.2 ) +annotate("text",x = (Q1 + Q2) /2, y = (P1 + P2) /2+5,label =TeX(r"($\Delta I = +25$)"),color ="darkgreen", size =4.5, fontface ="bold" ) +annotate("text",x = (Q1 + Q2) /2, y = (P1 + P2) /2-5,label =TeX(r"($\Delta P = +20,\ \Delta Q = +60$)"),color ="gray40", size =3.5, fontface ="italic" ) +labs(title ="Estática comparativa: efeito do aumento da renda",subtitle =TeX(r"($\partial P^*/\partial I = 0{,}8$ e $\partial Q^*/\partial I = 2{,}4$)"),x =TeX(r"(Quantidade de equilíbrio ($Q^*$))"),y =TeX(r"(Preço de equilíbrio ($P^*$))") ) +scale_x_continuous(breaks =seq(200, 300, by =20), limits =c(200, 310), expand =c(0, 0)) +scale_y_continuous(breaks =seq(80, 120, by =10), limits =c(80, 125), expand =c(0, 0)) +theme_minimal() +theme(plot.title =element_text(size =14, face ="bold"),plot.subtitle =element_text(size =11),axis.line =element_line(color ="black", linewidth =0.5),axis.title =element_text(size =11) )
Interpretação
O gráfico ilustra a essência da estática comparativa: quando a renda aumenta de \(I = 25\) para \(I = 50\), o equilíbrio se desloca de \(E_1\) (\(P^* = 90\), \(Q^* = 220\)) para \(E_2\) (\(P^* = 110\), \(Q^* = 280\)). A seta indica a direção da mudança, com \(\Delta I = +25\). As derivadas parciais \(\frac{\partial P^*}{\partial I} = 0{,}8\) e \(\frac{\partial Q^*}{\partial I} = 2{,}4\) quantificam a sensibilidade do equilíbrio à renda: ambas são positivas, indicando que o bem é normal — seu consumo aumenta com a renda.
Note 1.8: Equilíbrio oferta-demanda: mercado de amendoim
Enunciado
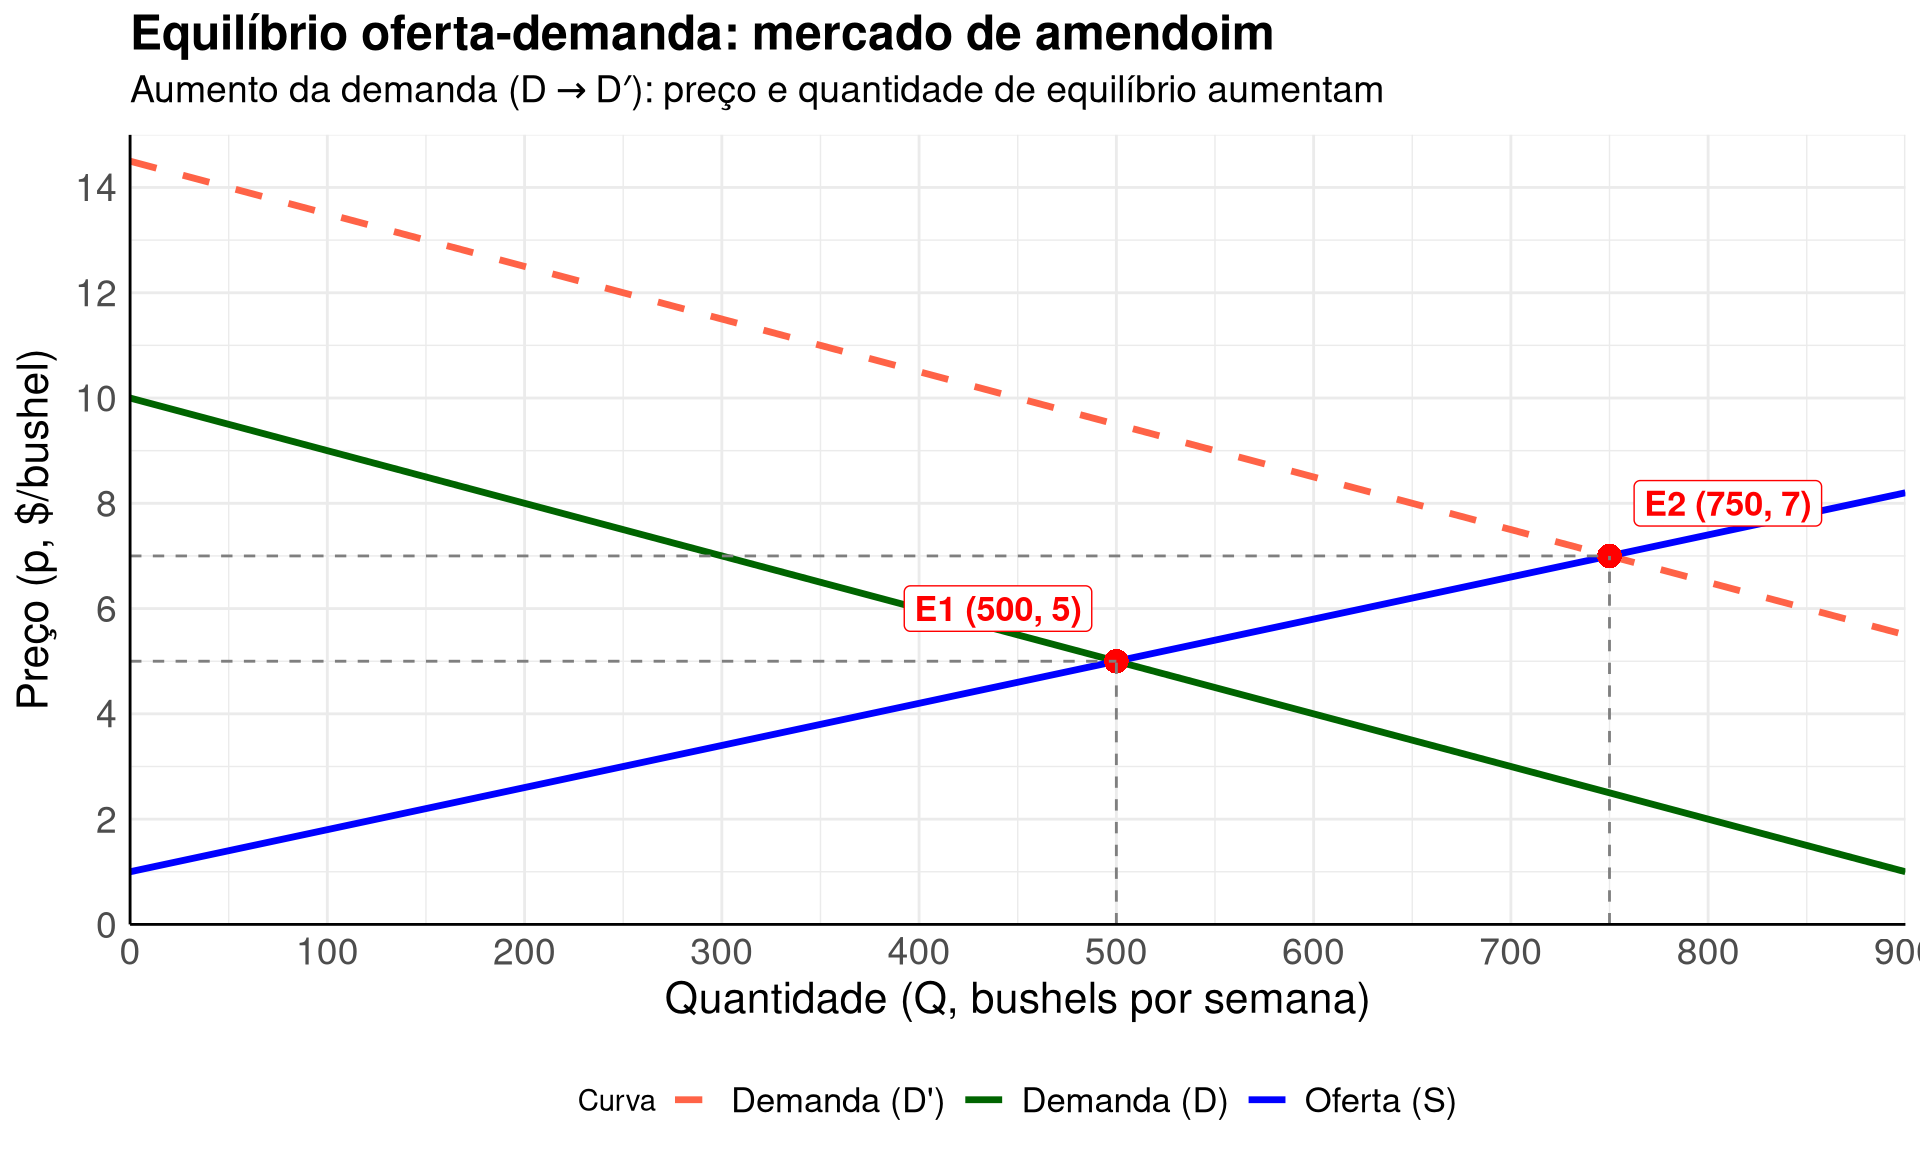
Baseado em Nicholson e Snyder (2018, exemplo 1.2). Suponha que desejamos estudar o mercado de amendoim e que a análise estatística de dados históricos concluiu que a quantidade demandada por semana (\(q\), medida em bushels) depende do preço (\(p\), medido em dólares por bushel) de acordo com:
\[q_D = 1{.}000 - 100p\]
A quantidade ofertada também depende do preço:
\[q_S = -125 + 125p\]
Determine: (a) o preço e a quantidade de equilíbrio; (b) apresente o modelo na forma geral e analise o efeito de deslocamentos da demanda e da oferta sobre o preço de equilíbrio.
Resolução
Parte (a): Equilíbrio numérico
No equilíbrio, \(q_D = q_S\):
\[1{.}000 - 100p = -125 + 125p\]
\[1{.}125 = 225p\]
\[p^* = 5\]
Substituindo na equação de demanda (ou de oferta):
\[q^* = 1{.}000 - 100 \times 5 = 500\]
Ao preço de $5 por bushel, o mercado está em equilíbrio: consumidores desejam comprar 500 bushels e produtores desejam vender exatamente 500 bushels.
Parte (b): Modelo geral e estática comparativa
Adotando a notação geral:
\[q_D = a + bp \quad \text{e} \quad q_S = c + dp\]
onde \(a\) e \(c\) são constantes que deslocam as curvas de demanda e oferta, respectivamente, e \(b < 0\) e \(d > 0\) representam as reações de demandantes e ofertantes ao preço. O equilíbrio exige \(q_D = q_S\):
O aumento na demanda elevou o preço de $5 para $7 e a quantidade de 500 para 750 bushels.
Implementação em R
Código
suppressPackageStartupMessages({library(ggplot2)library(dplyr)library(latex2exp)})# Funções inversas: P como função de Q# Demanda D1: Q = 1000 - 100P => P = (1000 - Q) / 100# Demanda D2: Q = 1450 - 100P => P = (1450 - Q) / 100# Oferta: Q = -125 + 125P => P = (Q + 125) / 125q_seq <-seq(0, 900, length.out =300)p_demanda1 <- (1000- q_seq) /100p_demanda2 <- (1450- q_seq) /100p_oferta <- (q_seq +125) /125# Equilíbriosp_eq1 <-5q_eq1 <-500p_eq2 <-7q_eq2 <-750dados_curvas <- tibble::tibble(Q =rep(q_seq, 3),P =c(p_demanda1, p_demanda2, p_oferta),Curva =rep(c("Demanda (D)", "Demanda (D')", "Oferta (S)"),each =length(q_seq) )) |> dplyr::filter(P >=0, P <=15, Q >=0)pontos_eq <- tibble::tibble(Q =c(q_eq1, q_eq2),P =c(p_eq1, p_eq2),label =c("E1", "E2"))ggplot() +geom_line(data = dados_curvas,aes(x = Q, y = P, color = Curva, linetype = Curva),linewidth =1.2 ) +geom_point(data = pontos_eq,aes(x = Q, y = P),color ="red", size =4, shape =16 ) +# Linhas tracejadas E1geom_segment(aes(x = q_eq1, xend = q_eq1, y =0, yend = p_eq1),linetype ="dashed", color ="gray50" ) +geom_segment(aes(x =0, xend = q_eq1, y = p_eq1, yend = p_eq1),linetype ="dashed", color ="gray50" ) +# Linhas tracejadas E2geom_segment(aes(x = q_eq2, xend = q_eq2, y =0, yend = p_eq2),linetype ="dashed", color ="gray50" ) +geom_segment(aes(x =0, xend = q_eq2, y = p_eq2, yend = p_eq2),linetype ="dashed", color ="gray50" ) +# Rótulos dos equilíbriosannotate("label", x = q_eq1 -60, y = p_eq1 +1,label =paste0("E1 (", q_eq1, ", ", p_eq1, ")"),color ="red", fontface ="bold", size =4.5,fill ="white", label.size =0.3 ) +annotate("label", x = q_eq2 +60, y = p_eq2 +1,label =paste0("E2 (", q_eq2, ", ", p_eq2, ")"),color ="red", fontface ="bold", size =4.5,fill ="white", label.size =0.3 ) +scale_color_manual(values =c("Demanda (D)"="darkgreen","Demanda (D')"="tomato","Oferta (S)"="blue" ) ) +scale_linetype_manual(values =c("Demanda (D)"="solid","Demanda (D')"="dashed","Oferta (S)"="solid" ) ) +labs(title ="Equilíbrio oferta-demanda: mercado de amendoim",subtitle =TeX(r"(Aumento da demanda ($D \rightarrow D'$): preço e quantidade de equilíbrio aumentam)"),x =TeX(r"(Quantidade ($Q$, bushels por semana))"),y =TeX(r"(Preço ($p$, \$/bushel))"),color ="Curva",linetype ="Curva" ) +scale_x_continuous(breaks =seq(0, 900, by =100), limits =c(0, 900), expand =c(0, 0)) +scale_y_continuous(breaks =seq(0, 14, by =2), limits =c(0, 15), expand =c(0, 0)) +theme_minimal() +theme(plot.title =element_text(size =18, face ="bold"),plot.subtitle =element_text(size =14),axis.line =element_line(color ="black", linewidth =0.5),axis.title =element_text(size =16, face ="bold"),axis.text =element_text(size =14),legend.position ="bottom",legend.text =element_text(size =13) )
Interpretação
O gráfico reproduz a Figura 1.3 de Nicholson e Snyder (2018): o equilíbrio inicial \(E_1\) (\(p^* = 5\), \(q^* = 500\)) é determinado pela interseção de \(D\) e \(S\). Quando a demanda se desloca para \(D'\) (intercepto aumenta de 1.000 para 1.450), o novo equilíbrio \(E_2\) apresenta preço e quantidade maiores (\(p^* = 7\), \(q^* = 750\)). A formulação geral permite prever o efeito de qualquer deslocamento: \(dp^*/da > 0\) confirma que aumentos na demanda elevam o preço, enquanto \(dp^*/dc < 0\) confirma que aumentos na oferta o reduzem — resultados consistentes com a análise gráfica.
Note 1.9: Fronteira de possibilidades de produção e ineficiência econômica
Enunciado
Baseado em Nicholson e Snyder (2018, exemplo 1.3). Considere uma economia que produz dois bens, \(x\) e \(y\), utilizando trabalho como único insumo. As funções de produção são:
\[x = l_x^{0{,}5} \quad \text{e} \quad y = 2l_y^{0{,}5}\]
onde \(l_x\) e \(l_y\) são as quantidades de trabalho alocadas à produção de cada bem. O total de trabalho disponível é \(l_x + l_y \leq 200\).
Determine:
a equação da FPP;
o custo de oportunidade de \(x\) em termos de \(y\);
o efeito da ineficiência (desemprego de 20 trabalhadores) sobre a FPP.
Resolução
Parte (a): Equação da FPP
O objetivo é eliminar \(l_x\) e \(l_y\) das funções de produção e expressá-las em termos de \(x\) e \(y\).
Passo 1: inverter as funções de produção. Precisamos isolar \(l_x\) e \(l_y\):
Para o bem \(x\): se \(x = l_x^{0{,}5}\), elevamos ambos os lados ao quadrado:
Passo 2: diferenciar usando a regra da cadeia. Temos \(y = (800 - 4x^2)^{0{,}5}\), que é uma função composta: a função externa é \(u^{0{,}5}\) e a função interna é \(u = 800 - 4x^2\).
A regra da cadeia diz que \(\frac{dy}{dx} = \frac{dy}{du} \cdot \frac{du}{dx}\):
Passo 3: simplificar. A expressão \((800 - 4x^2)^{-0{,}5}\) é o inverso de \((800 - 4x^2)^{0{,}5}\), que é justamente \(y\) (definido no passo 1). Portanto \((800 - 4x^2)^{-0{,}5} = 1/y\). Substituindo:
O resultado \(dy/dx = -4x/y\) é a taxa marginal de transformação (TMT): indica quantas unidades de \(y\) a economia sacrifica ao produzir uma unidade adicional de \(x\).
Exemplo numérico: se o trabalho é alocado igualmente (\(l_x = l_y = 100\)), então \(x = \sqrt{100} = 10\) e \(y = 2\sqrt{100} = 20\):
\[\frac{dy}{dx} = \frac{-4 \times 10}{20} = -2\]
Cada unidade adicional de \(x\) custa 2 unidades de \(y\).
Verificação discreta: transferindo 1 trabalhador de \(y\) para \(x\) (\(l_x = 101\), \(l_y = 99\)):
O resultado discreto confirma o cálculo com derivada. A concavidade da FPP implica custo de oportunidade crescente: à medida que se produz mais \(x\), a inclinação \(dy/dx\) se torna mais negativa (em valor absoluto).
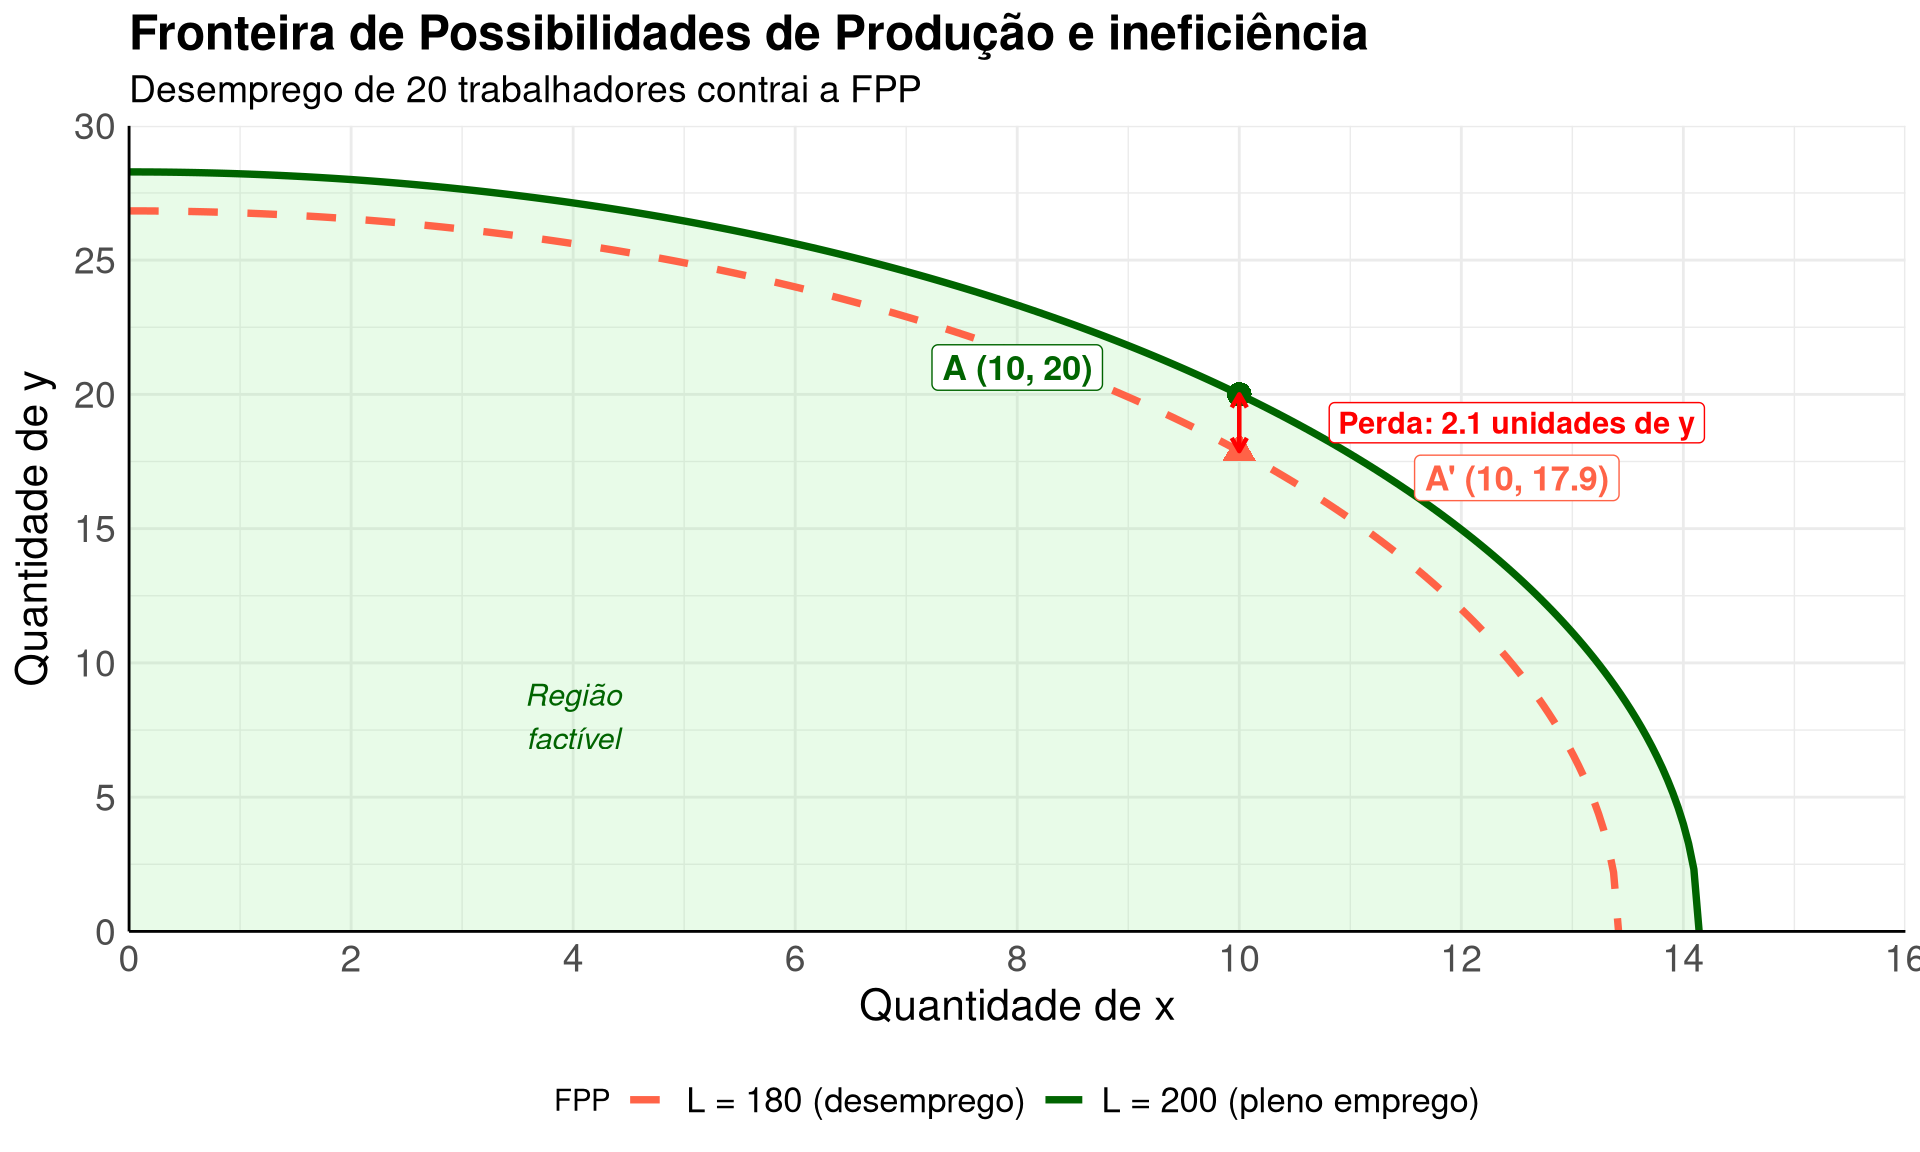
Parte (c): Ineficiência econômica
Se 20 trabalhadores estão permanentemente desempregados, a oferta efetiva de trabalho cai de 200 para 180. A nova FPP é:
\[x^2 + 0{,}25y^2 = 180\]
O que muda? Mantendo \(x = 10\) (\(l_x = 100\)), sobram apenas \(l_y = 80\) trabalhadores para \(y\):
\[y = 2\sqrt{80} = 2 \times 8{,}94 = 17{,}9\]
Antes, com \(l_y = 100\), a produção era \(y = 20\). A perda de 2,1 unidades de \(y\) é o custo da ineficiência.
Se os 180 trabalhadores fossem alocados igualmente (\(l_x = l_y = 90\)): \(x = \sqrt{90} \approx 9{,}5\) e \(y = 2\sqrt{90} \approx 19{,}0\). A ineficiência reduz a produção de ambos os bens em relação à FPP com pleno emprego.
Implementação em R
Código
suppressPackageStartupMessages({library(ggplot2)library(latex2exp)})# FPP eficiente: x^2 + 0.25y^2 = 200# y = sqrt(800 - 4x^2)x_max_eff <-sqrt(200)x_seq_eff <-seq(0, x_max_eff, length.out =300)y_seq_eff <-sqrt(pmax(800-4* x_seq_eff^2, 0))# FPP ineficiente: x^2 + 0.25y^2 = 180# y = sqrt(720 - 4x^2)x_max_ineff <-sqrt(180)x_seq_ineff <-seq(0, x_max_ineff, length.out =300)y_seq_ineff <-sqrt(pmax(720-4* x_seq_ineff^2, 0))# Pontos de referênciapontos <- tibble::tibble(x =c(10, 10),y =c(20, sqrt(320)),label =c("A: alocação igual (l=200)","A': alocação igual (l=180)" ),tipo =c("eficiente", "ineficiente"))# Dados das curvasfpp_eff <- tibble::tibble(x = x_seq_eff, y = y_seq_eff, FPP ="L = 200 (pleno emprego)")fpp_ineff <- tibble::tibble(x = x_seq_ineff, y = y_seq_ineff, FPP ="L = 180 (desemprego)")fpp_dados <- dplyr::bind_rows(fpp_eff, fpp_ineff)ggplot() +# Área sob a FPP eficientegeom_ribbon(data = fpp_eff,aes(x = x, ymin =0, ymax = y),fill ="lightgreen", alpha =0.2 ) +# Curvas FPPgeom_line(data = fpp_dados,aes(x = x, y = y, color = FPP, linetype = FPP),linewidth =1.3 ) +# Pontosgeom_point(data = pontos,aes(x = x, y = y, shape = tipo),size =4, color =c("darkgreen", "tomato") ) +# Segmento mostrando a perdageom_segment(aes(x =10, xend =10, y =sqrt(320), yend =20),arrow =arrow(length =unit(0.2, "cm"), ends ="both"),color ="red", linewidth =0.8 ) +annotate("label", x =12.5, y = (20+sqrt(320)) /2,label =paste0("Perda: ", round(20-sqrt(320), 1), " unidades de y"),color ="red", size =4, fontface ="bold",fill ="white", label.size =0.3 ) +# Rótulos dos pontosannotate("label", x =8, y =21,label ="A (10, 20)",color ="darkgreen", fontface ="bold", size =4.5,fill ="white", label.size =0.3 ) +annotate("label", x =12.5, y =sqrt(320) -1,label =paste0("A' (10, ", round(sqrt(320), 1), ")"),color ="tomato", fontface ="bold", size =4.5,fill ="white", label.size =0.3 ) +# Anotação da regiãoannotate("text", x =4, y =8,label ="Região\nfactível",size =4, color ="darkgreen", fontface ="italic" ) +scale_color_manual(values =c("L = 200 (pleno emprego)"="darkgreen","L = 180 (desemprego)"="tomato" ) ) +scale_linetype_manual(values =c("L = 200 (pleno emprego)"="solid","L = 180 (desemprego)"="dashed" ) ) +scale_shape_manual(values =c("eficiente"=16, "ineficiente"=17), guide ="none") +labs(title ="Fronteira de Possibilidades de Produção e ineficiência",subtitle ="Desemprego de 20 trabalhadores contrai a FPP",x =TeX(r"(Quantidade de $x$)"),y =TeX(r"(Quantidade de $y$)"),color ="FPP",linetype ="FPP" ) +scale_x_continuous(breaks =seq(0, 16, by =2), limits =c(0, 16), expand =c(0, 0)) +scale_y_continuous(breaks =seq(0, 30, by =5), limits =c(0, 30), expand =c(0, 0)) +theme_minimal() +theme(plot.title =element_text(size =18, face ="bold"),plot.subtitle =element_text(size =14),axis.line =element_line(color ="black", linewidth =0.5),axis.title =element_text(size =16, face ="bold"),axis.text =element_text(size =14),legend.position ="bottom",legend.text =element_text(size =13) )
Interpretação
O gráfico ilustra dois conceitos centrais de Nicholson e Snyder (2018). Primeiro, a FPP tem formato de quarto de elipse, refletindo o custo de oportunidade crescente: como as funções de produção exibem rendimentos decrescentes (\(x = l_x^{0{,}5}\)), transferir trabalho de \(y\) para \(x\) produz incrementos cada vez menores de \(x\) a um custo cada vez maior em termos de \(y\).
Segundo, a ineficiência econômica (neste caso, desemprego de 20 trabalhadores) contrai a fronteira para dentro. O ponto \(A\) sobre a FPP eficiente (\(x = 10\), \(y = 20\)) torna-se inatingível: com apenas 180 trabalhadores e a mesma alocação \(x = 10\), a produção de \(y\) cai para \(\approx 17{,}9\) (ponto \(A'\)). A diferença de 2,1 unidades de \(y\) mede o custo real da falha no mercado de trabalho. Se a ineficiência fosse resolvida, a economia poderia produzir mais de ambos os bens simultaneamente.
Referências
NICHOLSON, W.; SNYDER, C. Teoria microeconômica: princı́pios básicos e aplicações. [s.l.] Cengage Learning Edições, 2018.
PERLOFF, J. M. Microeconomics with Calculus, Global Edition. 5. ed. [s.l.] Pearson, 2022.
PINDYCK, R. S.; RUBINFELD, D. L. Microeconomia. [s.l.] Pearson Education do Brasil, 2013.
VARIAN, H. R. Microeconomia: uma abordagem moderna. [s.l.] Elsevier, 2012.