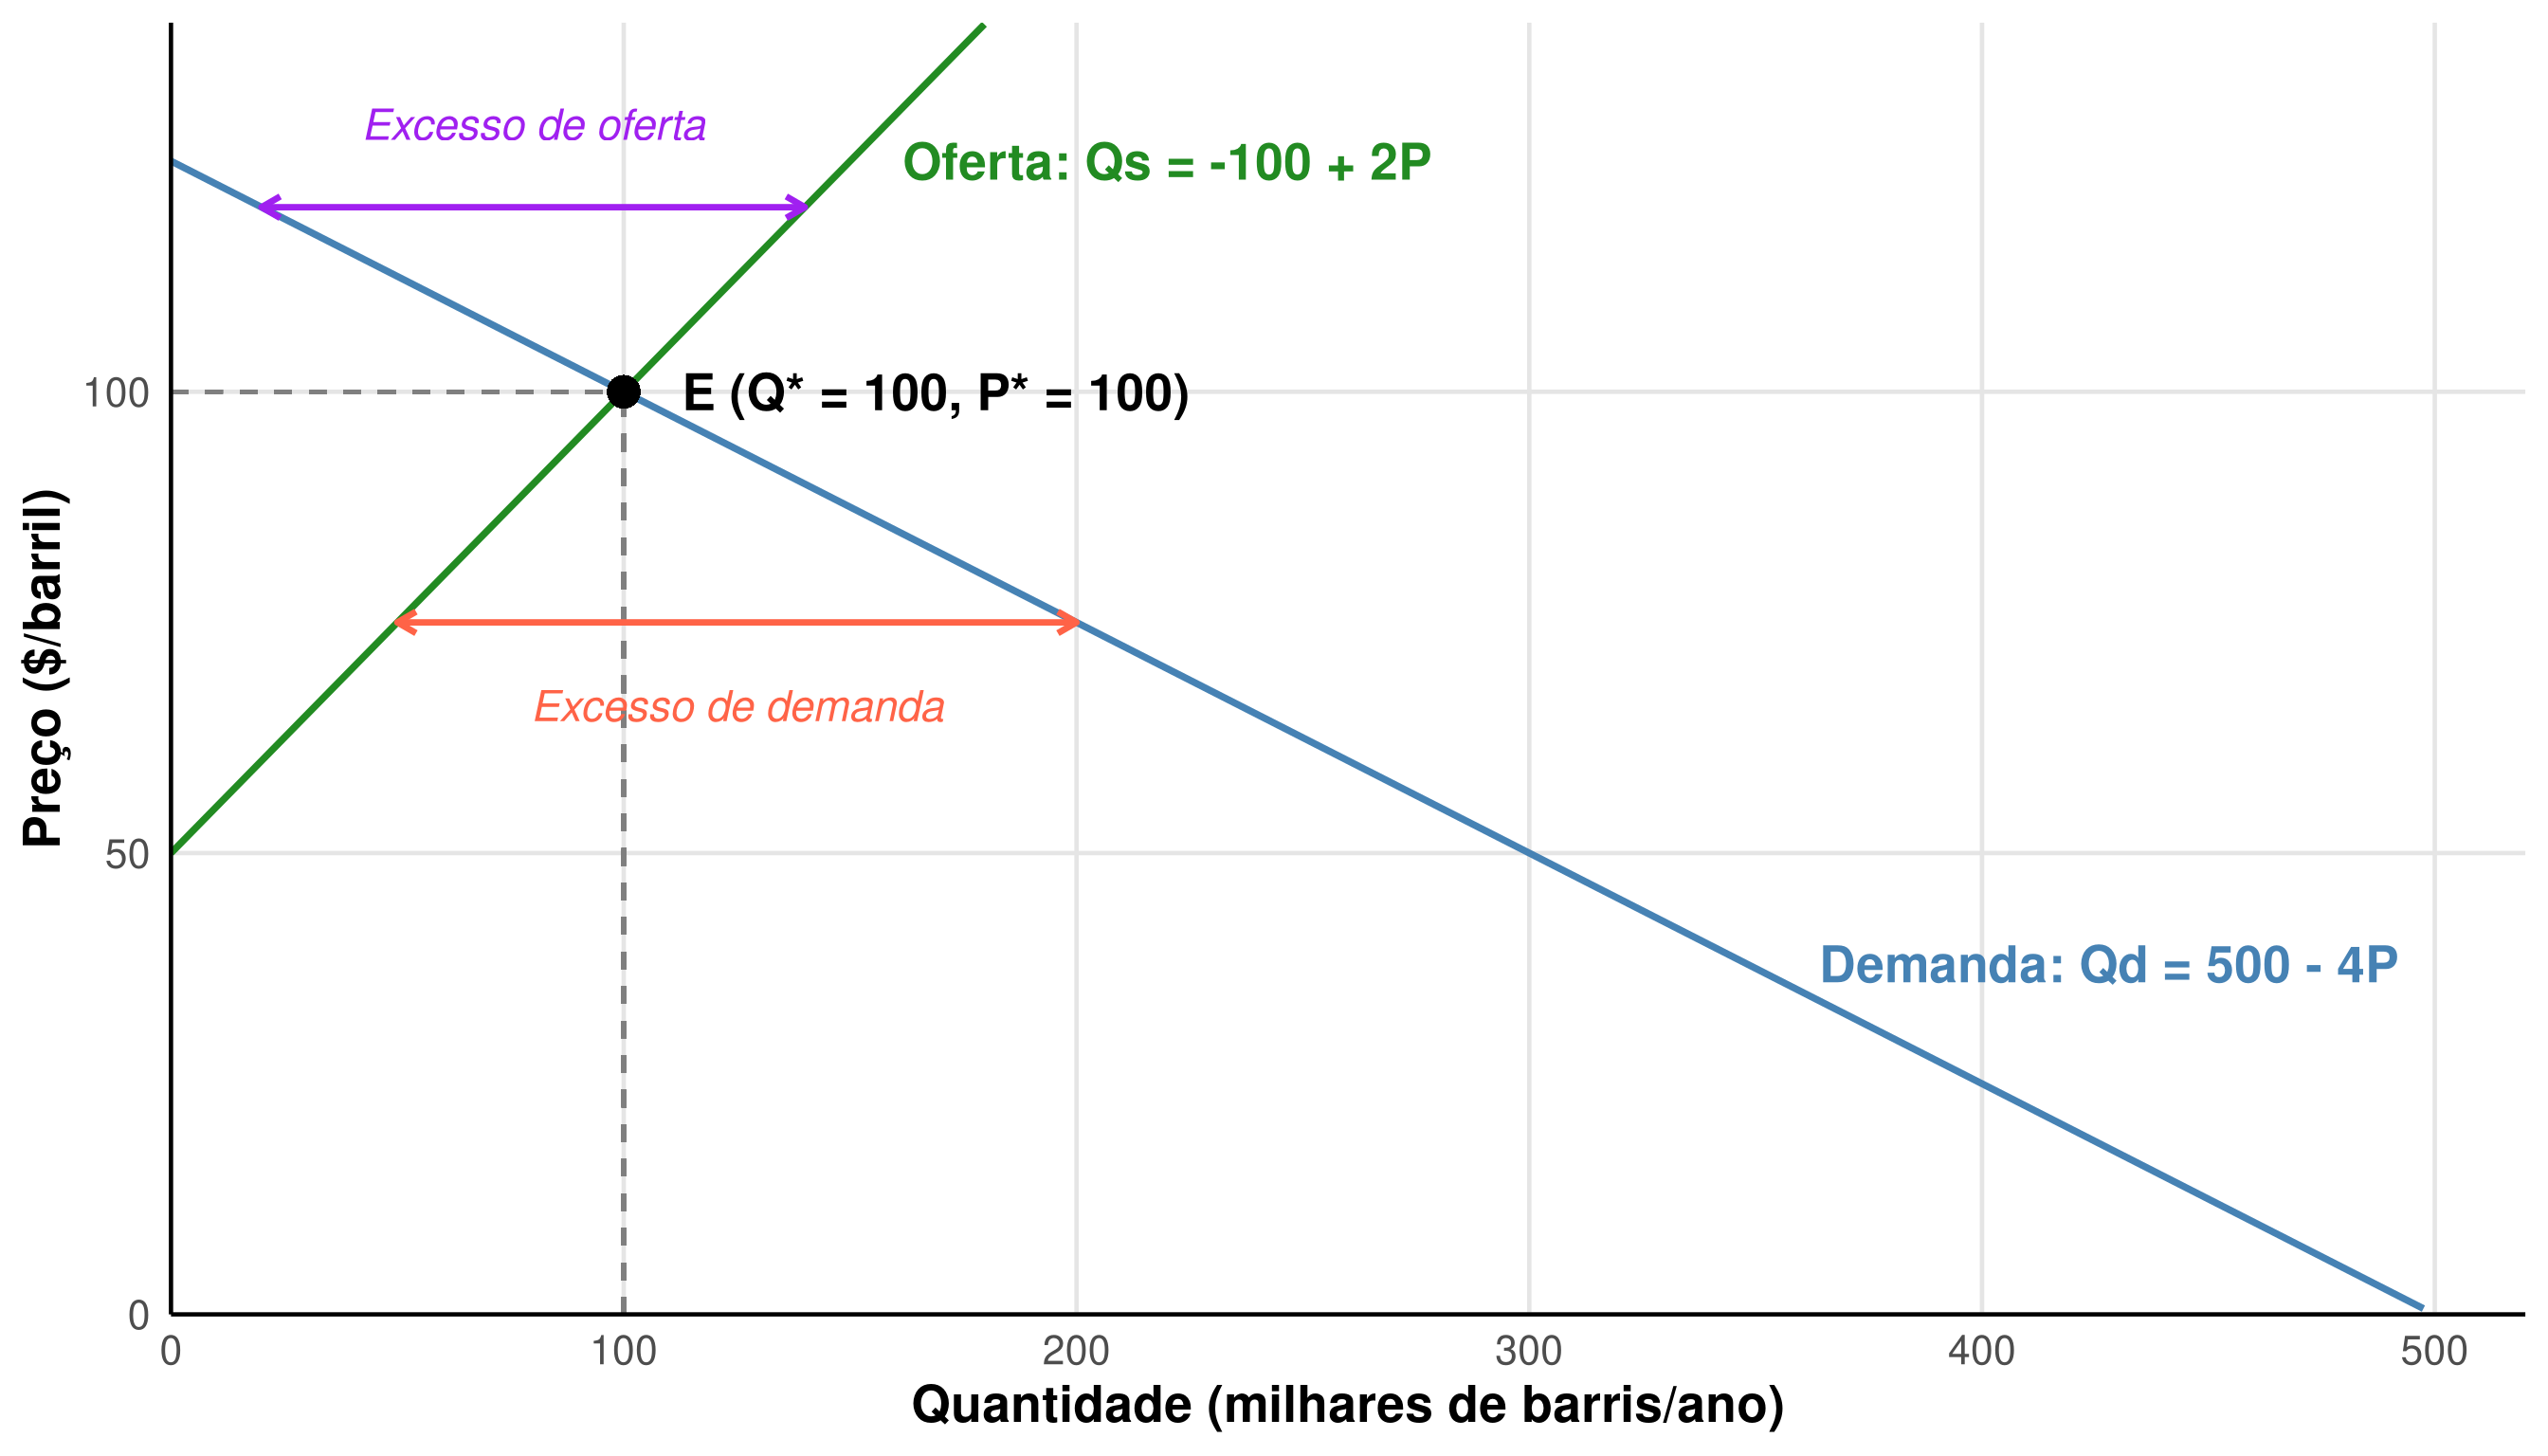
# Mercado de cranberries (Besanko 2014, Exercise 2.3)
# Demanda: Qd = 500 - 4P => P = (500 - Q) / 4 = 125 - 0.25Q
# Oferta: Qs = -100 + 2P => P = (Q + 100) / 2 = 50 + 0.5Q (quando P >= 50)
# Equilíbrio: P* = 100, Q* = 100

q_vals <- seq(0, 550, length.out = 200)
demanda <- data.frame(Q = q_vals, P = 125 - 0.25 * q_vals, Curva = "Demanda")
oferta <- data.frame(Q = q_vals, P = 50 + 0.5 * q_vals, Curva = "Oferta")

curvas <- bind_rows(demanda, oferta) |>
  filter(P >= 0, P <= 140)

Q_eq <- 100
P_eq <- 100

ggplot(curvas, aes(x = Q, y = P, color = Curva)) +
  geom_line(linewidth = 1.3) +
  # Linhas tracejadas até os eixos
  geom_segment(aes(x = Q_eq, y = 0, xend = Q_eq, yend = P_eq),
               linetype = "dashed", color = "gray50", linewidth = 0.8) +
  geom_segment(aes(x = 0, y = P_eq, xend = Q_eq, yend = P_eq),
               linetype = "dashed", color = "gray50", linewidth = 0.8) +
  # Ponto de equilíbrio
  geom_point(aes(x = Q_eq, y = P_eq), color = "black", size = 5) +
  annotate("text", x = Q_eq + 69, y = P_eq + 0,
           label = "E (Q* = 100, P* = 100)",
           size = 7, fontface = "bold") +
  # Rótulos das curvas
  annotate("text", x = 428, y = 38, label = "Demanda: Qd = 500 - 4P", size = 7, color = "steelblue", fontface = "bold") +
  annotate("text", x = 220, y = 125, label = "Oferta: Qs = -100 + 2P", size = 7, color = "forestgreen", fontface = "bold") +
  # Excesso de demanda (P = 75)
  annotate("segment", x = -100 + 2 * 75, y = 75, xend = 500 - 4 * 75, yend = 75,
           color = "tomato", linewidth = 1.2, linetype = "solid",
           arrow = arrow(length = unit(0.3, "cm"), ends = "both")) +
  annotate("text", x = (50 + 200) / 2, y = 66,
           label = "Excesso de demanda", size = 6, color = "tomato", fontface = "italic") +
  # Excesso de oferta (P = 120)
  annotate("segment", x = 500 - 4 * 120, y = 120, xend = -100 + 2 * 120, yend = 120,
           color = "purple", linewidth = 1.2, linetype = "solid",
           arrow = arrow(length = unit(0.3, "cm"), ends = "both")) +
  annotate("text", x = (20 + 140) / 2, y = 129,
           label = "Excesso de oferta", size = 6, color = "purple", fontface = "italic") +
  scale_color_manual(values = c("Demanda" = "steelblue", "Oferta" = "forestgreen")) +
  labs(
    title = NULL,
    x = "Quantidade (milhares de barris/ano)",
    y = "Preço ($/barril)"
  ) +
  scale_x_continuous(limits = c(0, 520), expand = c(0, 0)) +
  scale_y_continuous(limits = c(0, 140), expand = c(0, 0)) +
  tema_economico +
  theme(
    legend.position = "none",
    axis.title = element_text(size = 20, face = "bold"),
    axis.text = element_text(size = 16)
  )