Uma propriedade central das funções de demanda Marshallianas é que elas são homogêneas de grau zero em preços e renda. Formalmente, para qualquer fator de escala \(t > 0\):
\[x^*(t p_x, t p_y, t I) = x^*(p_x, p_y, I)\]
\[y^*(t p_x, t p_y, t I) = y^*(p_x, p_y, I)\]
A intuição é direta: se todos os preços e a renda do consumidor são multiplicados pelo mesmo fator, nem os preços relativos nem o poder de compra real mudam — portanto, a cesta ótima escolhida também não muda (Nicholson e Snyder, 2012).
A prova formal vem diretamente da restrição orçamentária. Considere o conjunto de cestas factíveis aos preços e renda originais:
\[\begin{aligned}
p_x x + p_y y &= I & & \text{restrição orçamentária original}
\end{aligned}\]
Agora multiplique todos os preços e a renda por \(t > 0\) e escreva a nova restrição:
\[\begin{aligned}
t p_x x + t p_y y &= t I & & \text{multiplicando tudo por } t \\[6pt]
t (p_x x + p_y y) &= t I & & \text{fatorando } t \text{ no lado esquerdo} \\[6pt]
p_x x + p_y y &= I & & \text{dividindo ambos os lados por } t
\end{aligned}\]
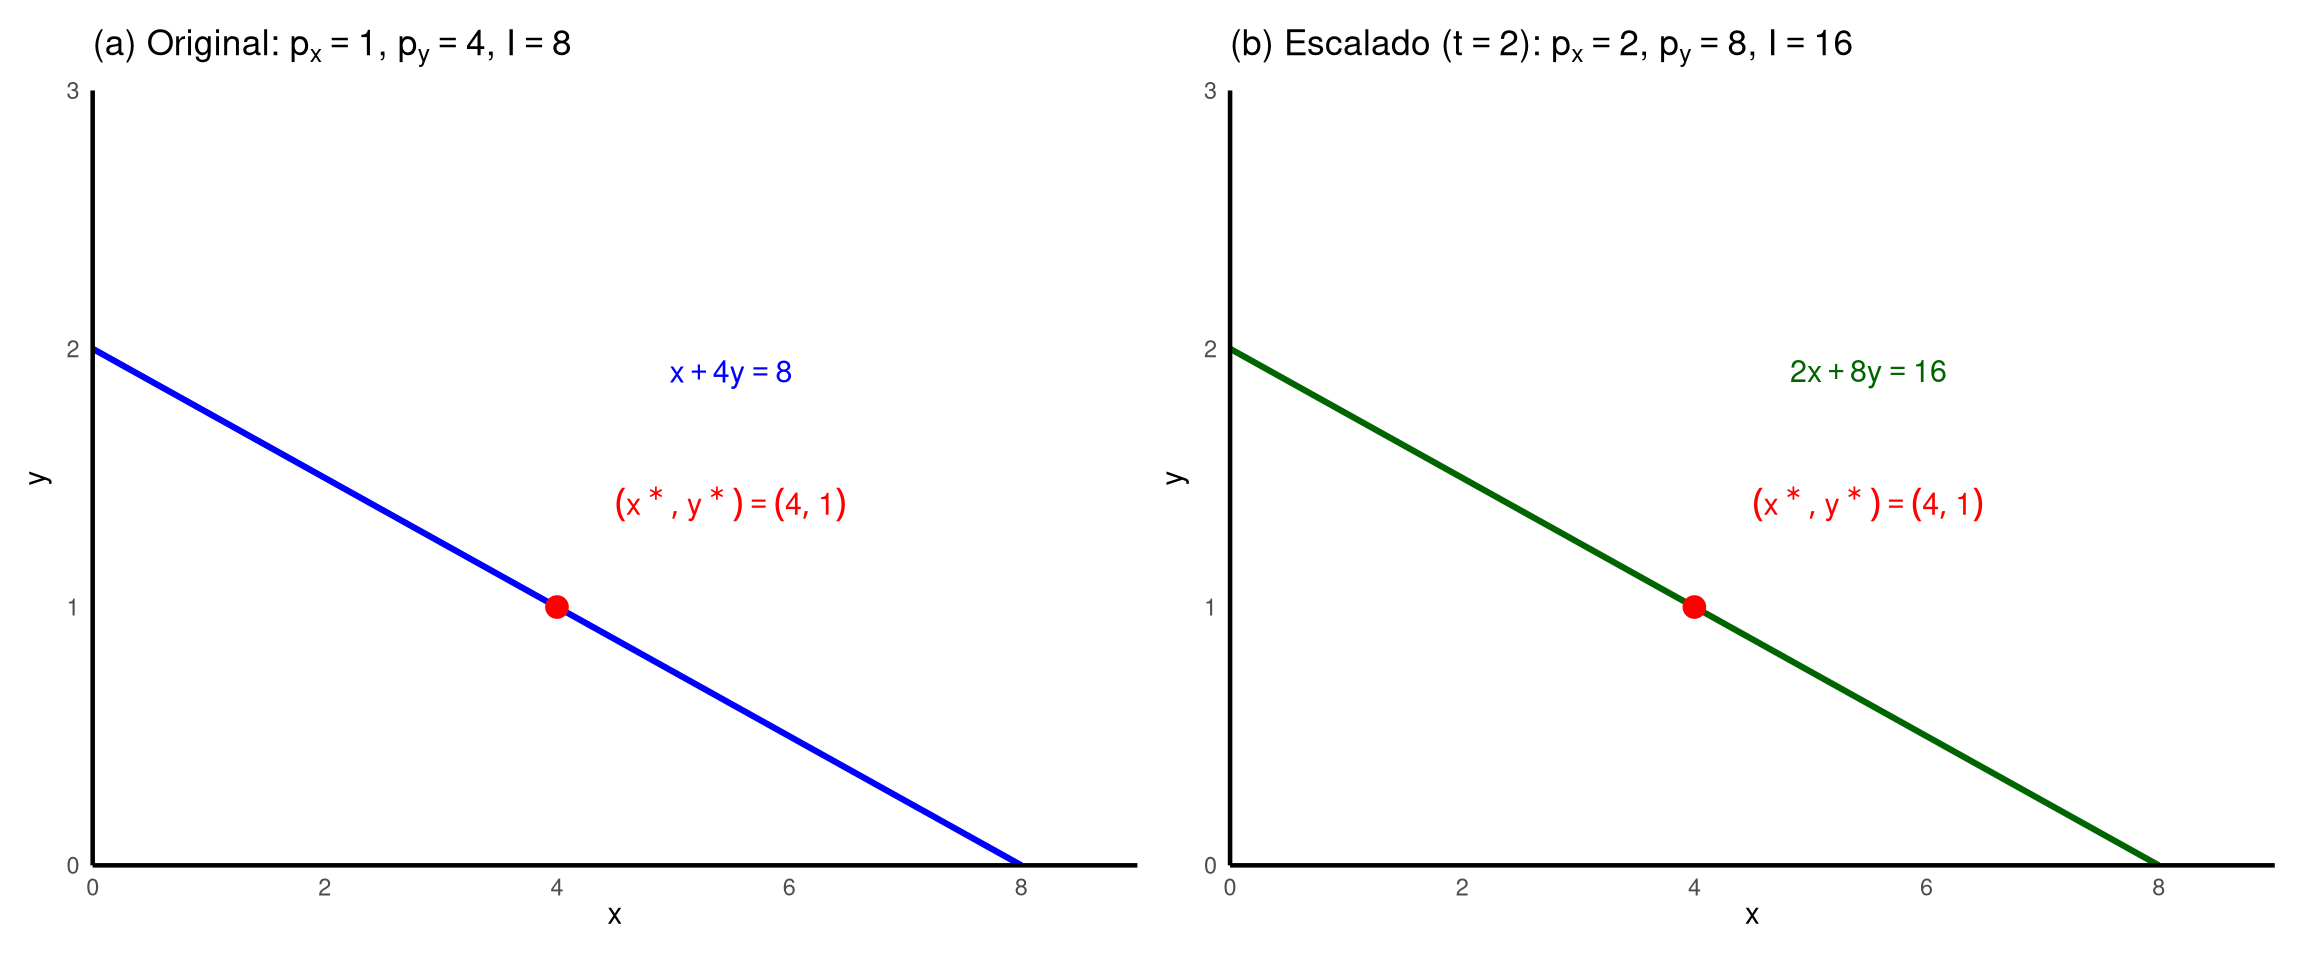
A nova restrição é algebricamente idêntica à original. Como o conjunto factível não se altera e as preferências do consumidor também não dependem dos valores monetários dos preços, o problema de maximização é o mesmo — e, portanto, a cesta ótima é a mesma.
Geometricamente, a reta orçamentária não muda: nem a inclinação \(-p_x/p_y\) (pois \(-t p_x / t p_y = -p_x/p_y\)) nem os interceptos \(I/p_x\) e \(I/p_y\) (pois \(t I / t p_x = I / p_x\)) são afetados pela escala comum. O consumidor vê exatamente a mesma fronteira de oportunidades (Nicholson e Snyder, 2012).
A homogeneidade de grau zero tem uma implicação econômica direta: uma inflação “pura”, em que todos os preços e a renda nominal variam na mesma proporção, não altera as quantidades demandadas. A demanda depende dos preços relativos (\(p_x/p_y\)) e da renda real (\(I/p_x\), \(I/p_y\)), nunca de valores monetários absolutos. Trocar reais por centavos multiplicando tudo por 100 resultaria na mesma cesta ótima.
O contraste com uma inflação não-uniforme é essencial: quando apenas alguns preços sobem, ou sobem em proporções diferentes, os preços relativos mudam e a reta orçamentária gira, alterando a cesta ótima. Os próximos callouts (Note 5.2, Note 5.3) exploram esses casos, em que a homogeneidade não se aplica porque o choque não é uniforme.
Note 5.2: Variações na renda: bens normais e inferiores
Símbolo
Significado
\(I_1 < I_2 < I_3\)
níveis crescentes de renda (preços fixos)
\(\partial x^*/\partial I\)
variação da demanda Marshalliana do bem \(x\) em resposta à renda
\(\partial x^*/\partial I \geq 0\)
bem normal — consumo não diminui quando a renda sobe
\(\partial x^*/\partial I < 0\)
bem inferior — consumo cai quando a renda sobe
curva de Engel
relação \(x^*(I)\) com \(p_x\) e \(p_y\) fixos
Desenvolvimento Teórico
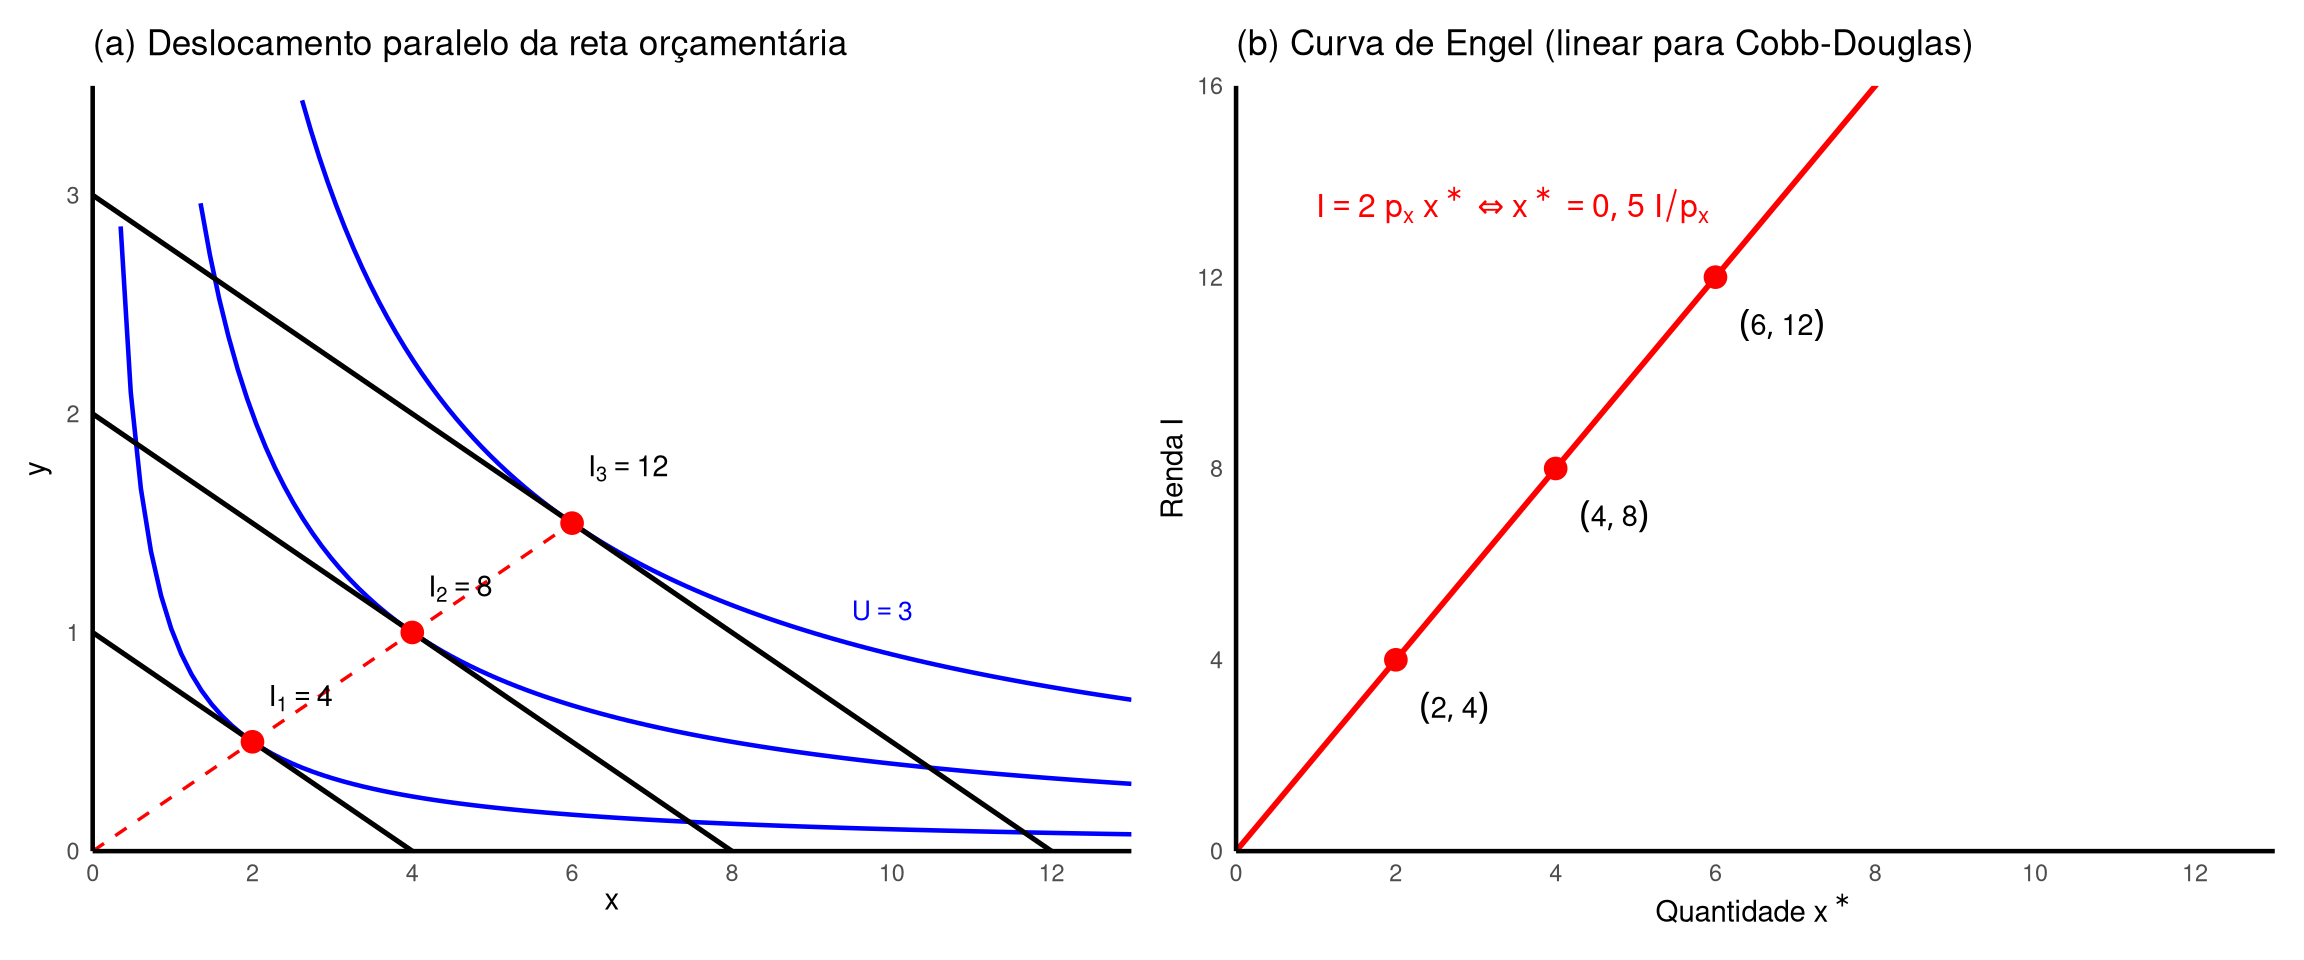
Uma variação na renda nominal \(I\), mantendo os preços \(p_x\) e \(p_y\) constantes, produz um deslocamento paralelo da reta orçamentária. A inclinação \(-p_x/p_y\) permanece inalterada — afinal, os preços relativos não mudaram — mas os dois interceptos, \(I/p_x\) no eixo horizontal e \(I/p_y\) no eixo vertical, escalam proporcionalmente com \(I\). Um aumento na renda empurra a reta orçamentária para fora (paralelamente a si mesma); uma queda na renda a empurra para dentro (Nicholson e Snyder, 2012).
Como o conjunto factível se expande (ou contrai) sem que os preços relativos se alterem, a nova cesta ótima é a tangência entre a nova reta orçamentária e uma curva de indiferença diferente. A Fig. 5.1 de Nicholson e Snyder (2012) ilustra esse movimento com três rendas crescentes \(I_1 < I_2 < I_3\), gerando três retas paralelas e três pontos de tangência — um em cada curva de indiferença sucessivamente mais elevada. Unindo esses pontos ótimos no plano \((x, y)\), obtém-se a curva renda-consumo (income expansion path).
Um bem é normal quando seu consumo aumenta (ou ao menos não diminui) com a renda; é inferior quando seu consumo efetivamente cai quando a renda sobe. Note que a classificação é local — um mesmo bem pode ser normal em certas faixas de renda e inferior em outras. A Fig. 5.2 de Nicholson e Snyder (2012) mostra o caso de um bem inferior: quando a renda passa de \(I_2\) para \(I_3\), a tangência se desloca para a esquerda no eixo \(x\), indicando que \(\partial x^*/\partial I < 0\). Esse padrão exige preferências não-homotéticas — curvas de indiferença cujas inclinações ao longo de um raio saído da origem não se repetem (Nicholson e Snyder, 2012).
Fixando \(p_x\) e \(p_y\), a função \(x^*(I)\) — com \(p_x, p_y\) como parâmetros — é chamada de curva de Engel do bem \(x\). Ela é o análogo, no espaço renda-quantidade, da curva de demanda no espaço preço-quantidade: registra como a quantidade ótima de \(x\) responde a variações exclusivas da renda. Curvas de Engel crescentes correspondem a bens normais; curvas decrescentes (em alguma faixa), a bens inferiores.
Exercício Resolvido
Considere a função utilidade Cobb-Douglas \(U(x, y) = x^{0{,}5} y^{0{,}5}\), com preços \(p_x = 1\) e \(p_y = 4\).
Para a Cobb-Douglas \(U = x^\alpha y^\beta\) com \(\alpha + \beta = 1\), a derivação via Lagrangiano (ver Note 4.5) produz as demandas Marshallianas \(x^* = \alpha I/p_x\) e \(y^* = \beta I/p_y\). Com \(\alpha = \beta = 0{,}5\) (fio-condutor deste capítulo):
\[\begin{aligned}
x^*(p_x, p_y, I) &= \frac{0{,}5 \, I}{p_x} & & \text{demanda Marshalliana Cobb-Douglas} \\[6pt]
\frac{\partial x^*}{\partial I} &= \frac{0{,}5}{p_x} & & \text{derivada parcial em relação a } I \\[6pt]
&= \frac{0{,}5}{1} = 0{,}5 > 0 & & \text{avaliada em } p_x = 1
\end{aligned}\]
Como \(\partial x^*/\partial I = 0{,}5 > 0\) para qualquer \(p_x > 0\), o bem \(x\) é normal. O mesmo raciocínio aplicado a \(y^*\) mostra que \(y\) também é normal. Esse é um resultado geral: a forma funcional Cobb-Douglas sempre produz bens normais, pois as frações de gasto \(\alpha = 0{,}5\) e \(1 - \alpha = 0{,}5\) são positivas e constantes.
Tabela numérica. Variando a renda em \(I \in \{4, 8, 12\}\) com \(p_x = 1\) e \(p_y = 4\):
\(I\)
\(x^* = 0{,}5 I / p_x\)
\(y^* = 0{,}5 I / p_y\)
\(U^* = \sqrt{x^* y^*}\)
4
2
0,5
1
8
4
1
2
12
6
1,5
3
Observe que, para Cobb-Douglas, a curva de Engel é linear e passa pela origem — a relação entre \(x^*\) e \(I\) é \(x^* = 0{,}5 \, I\), com inclinação constante igual a \(0{,}5/p_x\). Dobrar a renda dobra a quantidade demandada de cada bem; triplicar triplica. A elasticidade-renda é unitária.
Implementação em R
Código
# Painel (a): réplica da Fig 5.1 — mapa de indiferença com 3 tangências# Curvas de indiferença Cobb-Douglas U = sqrt(x y) => y = U^2 / x# U = 1 => y = 1/x ; U = 2 => y = 4/x ; U = 3 => y = 9/x# Retas orçamentárias (p_x = 1, p_y = 4):# I = 4 => de (0, 1) a (4, 0)# I = 8 => de (0, 2) a (8, 0)# I = 12 => de (0, 3) a (12, 0)# Tangências: (2, 0.5), (4, 1), (6, 1.5) — sobre a reta renda-consumop_a <-ggplot() +# Curvas de indiferençageom_function(fun = \(x) 1/ x, xlim =c(0.35, 13),color ="blue", linewidth =0.8) +geom_function(fun = \(x) 4/ x, xlim =c(1.35, 13),color ="blue", linewidth =0.8) +geom_function(fun = \(x) 9/ x, xlim =c(2.3, 13),color ="blue", linewidth =0.8) +# Retas orçamentárias paralelasgeom_segment(aes(x =0, y =1, xend =4, yend =0),color ="black", linewidth =0.9) +geom_segment(aes(x =0, y =2, xend =8, yend =0),color ="black", linewidth =0.9) +geom_segment(aes(x =0, y =3, xend =12, yend =0),color ="black", linewidth =0.9) +# Curva renda-consumo (tracejada, passa pela origem)geom_segment(aes(x =0, y =0, xend =6, yend =1.5),color ="red", linewidth =0.6, linetype ="dashed") +# Pontos ótimosgeom_point(aes(x =c(2, 4, 6), y =c(0.5, 1, 1.5)),color ="red", size =3.5) +# Rótulos dos níveis de renda e utilidadeannotate("text", x =2.2, y =0.7,label = latex2exp::TeX(r"($I_1 = 4$)"),size =3.8, hjust =0) +annotate("text", x =4.2, y =1.2,label = latex2exp::TeX(r"($I_2 = 8$)"),size =3.8, hjust =0) +annotate("text", x =6.2, y =1.75,label = latex2exp::TeX(r"($I_3 = 12$)"),size =3.8, hjust =0) +annotate("text", x =9.5, y =1.1,label = latex2exp::TeX(r"($U = 3$)"),size =3.5, color ="blue", hjust =0) +scale_x_continuous(expand =c(0, 0),limits =c(0, 13),breaks =seq(0, 12, 2) ) +scale_y_continuous(expand =c(0, 0),limits =c(0, 3.5),breaks =seq(0, 3, 1) ) +labs(x = latex2exp::TeX(r"($x$)"),y = latex2exp::TeX(r"($y$)"),title = latex2exp::TeX(r"((a) Deslocamento paralelo da reta orçamentária)") ) +theme_minimal() +theme(axis.line =element_line(color ="black", linewidth =0.8),panel.grid =element_blank() )# Painel (b): curva de Engel no plano (x^*, I).# Relação: x^* = 0,5 I / p_x <=> I = 2 p_x x^* (com p_x = 1: I = 2 x^*).# Pontos: (x^*, I) = (2, 4), (4, 8), (6, 12).# Eixo horizontal alinhado ao painel (a): 0 a 13.p_b <-ggplot() +geom_abline(slope =2, intercept =0,color ="red", linewidth =1) +geom_point(aes(x =c(2, 4, 6), y =c(4, 8, 12)),color ="red", size =3.5) +annotate("text", x =2.3, y =3.0,label = latex2exp::TeX(r"($(2, 4)$)"),size =3.8, hjust =0) +annotate("text", x =4.3, y =7.0,label = latex2exp::TeX(r"($(4, 8)$)"),size =3.8, hjust =0) +annotate("text", x =6.3, y =11.0,label = latex2exp::TeX(r"($(6, 12)$)"),size =3.8, hjust =0) +annotate("text", x =1, y =13.5,label = latex2exp::TeX(r"($I = 2 \, p_x \, x^* \Leftrightarrow x^* = 0{,}5 \, I / p_x$)"),size =4.2, color ="red", hjust =0) +scale_x_continuous(expand =c(0, 0),limits =c(0, 13),breaks =seq(0, 12, 2) ) +scale_y_continuous(expand =c(0, 0),limits =c(0, 16),breaks =seq(0, 16, 4) ) +labs(x = latex2exp::TeX(r"(Quantidade $x^*$)"),y = latex2exp::TeX(r"(Renda $I$)"),title = latex2exp::TeX(r"((b) Curva de Engel (linear para Cobb-Douglas))") ) +theme_minimal() +theme(axis.line =element_line(color ="black", linewidth =0.8),panel.grid =element_blank() )p_a + p_b
Interpretação
A Cobb-Douglas gera, por construção, apenas bens normais com elasticidade-renda unitária: as frações de gasto são constantes (\(\alpha\) e \(1-\alpha\)), de modo que dobrar a renda dobra exatamente as quantidades demandadas. A curva de Engel resulta linear, passando pela origem. A existência de bens inferiores (\(\partial x^*/\partial I < 0\)) exige preferências não-homotéticas, nas quais a taxa marginal de substituição varia ao longo de um raio saído da origem. Exemplos clássicos: batata vs. carne, ônibus vs. carro, roupa usada vs. nova. À medida que a renda sobe, o consumidor migra para o substituto superior.
A análise de como o consumo responde à renda remonta ao estatístico Ernst Engel (1821–1896), cuja Lei de Engel documentou empiricamente que a fração do orçamento familiar destinada à alimentação diminui à medida que a renda aumenta, mesmo que o gasto absoluto com alimentação cresça. Alimentação tem, portanto, elasticidade-renda positiva mas menor que 1.
A Cobb-Douglas produz frações de gasto constantes, contradizendo frontalmente a Lei de Engel. Por isso, trabalhos aplicados (estimação de sistemas de demanda, análise de pobreza, tributação ótima) adotam formas funcionais mais flexíveis como Stone-Geary, CES generalizada, AIDS e QUAIDS, capazes de acomodar elasticidades-renda variáveis e a distinção empírica entre bens normais, inferiores e de luxo.
Note 5.3: Efeitos renda e substituição de uma variação de preço
Símbolo
Significado
ET
efeito total \(= \Delta x\) entre cesta inicial (\(A\)) e final (\(C\))
ES
efeito substituição — movimento ao longo de \(U_1\) (\(A \to B\))
ER
efeito renda — mudança de \(U_1\) para \(U_2\) (\(B \to C\))
\(U_1\)
curva de indiferença original (antes da variação de preço)
\(U_2\)
curva de indiferença final (após a variação de preço)
\(x_B\)
cesta auxiliar — novos preços relativos com utilidade original \(U_1\)
ET = ES + ER
identidade de decomposição
Desenvolvimento Teórico
Diferentemente de uma variação na renda (que só desloca paralelamente a reta orçamentária) ou de uma variação proporcional em todos os preços (que não altera nada, pela homogeneidade), uma variação em um único preço \(p_x\) altera simultaneamente a inclinação \(-p_x/p_y\) e a posição da reta orçamentária. A nova cesta ótima pode diferir da anterior por duas razões distintas, que a análise de Hicks propõe separar conceitualmente (Nicholson e Snyder, 2012).
Para isso, a decomposição usa três cestas de referência, que aparecem marcadas nas Figs. 5.3 e 5.4 de Nicholson e Snyder (2012) e no gráfico em R ao final deste callout:
Ponto \(A = (x^*_A, y^*_A)\): cesta inicial, escolhida aos preços antigos e com renda \(I\). Situa-se sobre a reta orçamentária original e sobre a curva de indiferença \(U_1\).
Ponto \(B = (x_B, y_B)\): cesta auxiliar, construída por um exercício mental. Aos preços novos, mas com a renda ajustada (compensada) de forma que o consumidor ainda atinja a utilidade original \(U_1\). Geometricamente, \(B\) é o ponto de tangência entre \(U_1\) e uma reta orçamentária com a nova inclinação \(-p_x'/p_y\).
Ponto \(C = (x^*_C, y^*_C)\): cesta final, efetivamente escolhida aos preços novos com a renda original \(I\). Situa-se sobre a nova reta orçamentária e sobre uma nova curva de indiferença \(U_2\).
O movimento observado no mundo é \(A \to C\) (do antes ao depois da variação de preço). A análise de Hicks insere o ponto \(B\) como um intermediário conceitual que permite decompor esse movimento em duas parcelas:
Efeito substituição (ES), \(A \to B\): mesmo se a renda fosse ajustada (compensada) para manter a utilidade original \(U_1\), o consumidor realocaria sua cesta porque os preços relativos mudaram. Graficamente, isso corresponde a uma reta orçamentária auxiliar paralela à nova reta mas tangente a \(U_1\), cujo ponto de tangência é \(B\). O movimento \(A \to B\) ocorre sempre no sentido contrário à variação do preço: se \(p_x\) sobe, \(x_B < x^*_A\); se \(p_x\) cai, \(x_B > x^*_A\).
Efeito renda (ER), \(B \to C\): removida a compensação hipotética, o consumidor dispõe apenas de sua renda original \(I\) — que agora compra uma cesta menor (alta de preço) ou maior (queda). A reta orçamentária se move paralelamente à auxiliar até a nova reta orçamentária verdadeira, e a cesta ótima se desloca de \(B\) para \(C\), situando-se na nova curva de indiferença \(U_2\). O sinal deste efeito depende de o bem ser normal ou inferior.
A Fig. 5.3 de Nicholson e Snyder (2012) ilustra o caso de uma queda de preço (\(\Delta p_x < 0\)): a reta orçamentária gira para fora no eixo \(x\), o consumidor se move para uma curva de indiferença superior (\(U_2 > U_1\)), e a cesta ótima desloca-se para a direita. A Fig. 5.4 mostra o caso simétrico de alta de preço (\(\Delta p_x > 0\)): a reta gira para dentro, o consumidor se move para uma curva inferior (\(U_2 < U_1\)), e a cesta desloca-se para a esquerda. Em ambos, a reta auxiliar tangente a \(U_1\) isola o efeito substituição.
ES tem sinal oposto ao da variação do preço — é uma consequência da curvatura (convexidade) das curvas de indiferença e não depende das preferências específicas.
ER tem sinal que depende do tipo de bem. Para bens normais, uma alta de preço reduz a renda real e reduz o consumo de \(x\) (ER negativo) — reforça o ES. Para bens inferiores, uma alta de preço reduz a renda real e aumenta o consumo de \(x\) (ER positivo) — antagoniza o ES. Em casos extremos (bens Giffen), o ER é tão forte que domina o ES, invertendo o sinal do efeito total: a demanda passa a ter inclinação positiva.
Tabela-resumo dos sinais (para queda de preço, \(\Delta p_x < 0\)):
Tipo de bem
ES
ER
ET
Normal
\(+\)
\(+\)
\(+\)
Inferior
\(+\)
\(-\)
indeterminado (em geral \(+\))
Giffen
\(+\)
\(-\) (forte)
\(-\) (demanda sobe quando preço sobe)
Para um aumento de preço (\(\Delta p_x > 0\)), todos os sinais se invertem: ES é negativo para qualquer bem; ER é negativo para normais, positivo para inferiores; e ET é negativo para normais, indeterminado para inferiores, positivo para Giffen.
Exercício Resolvido
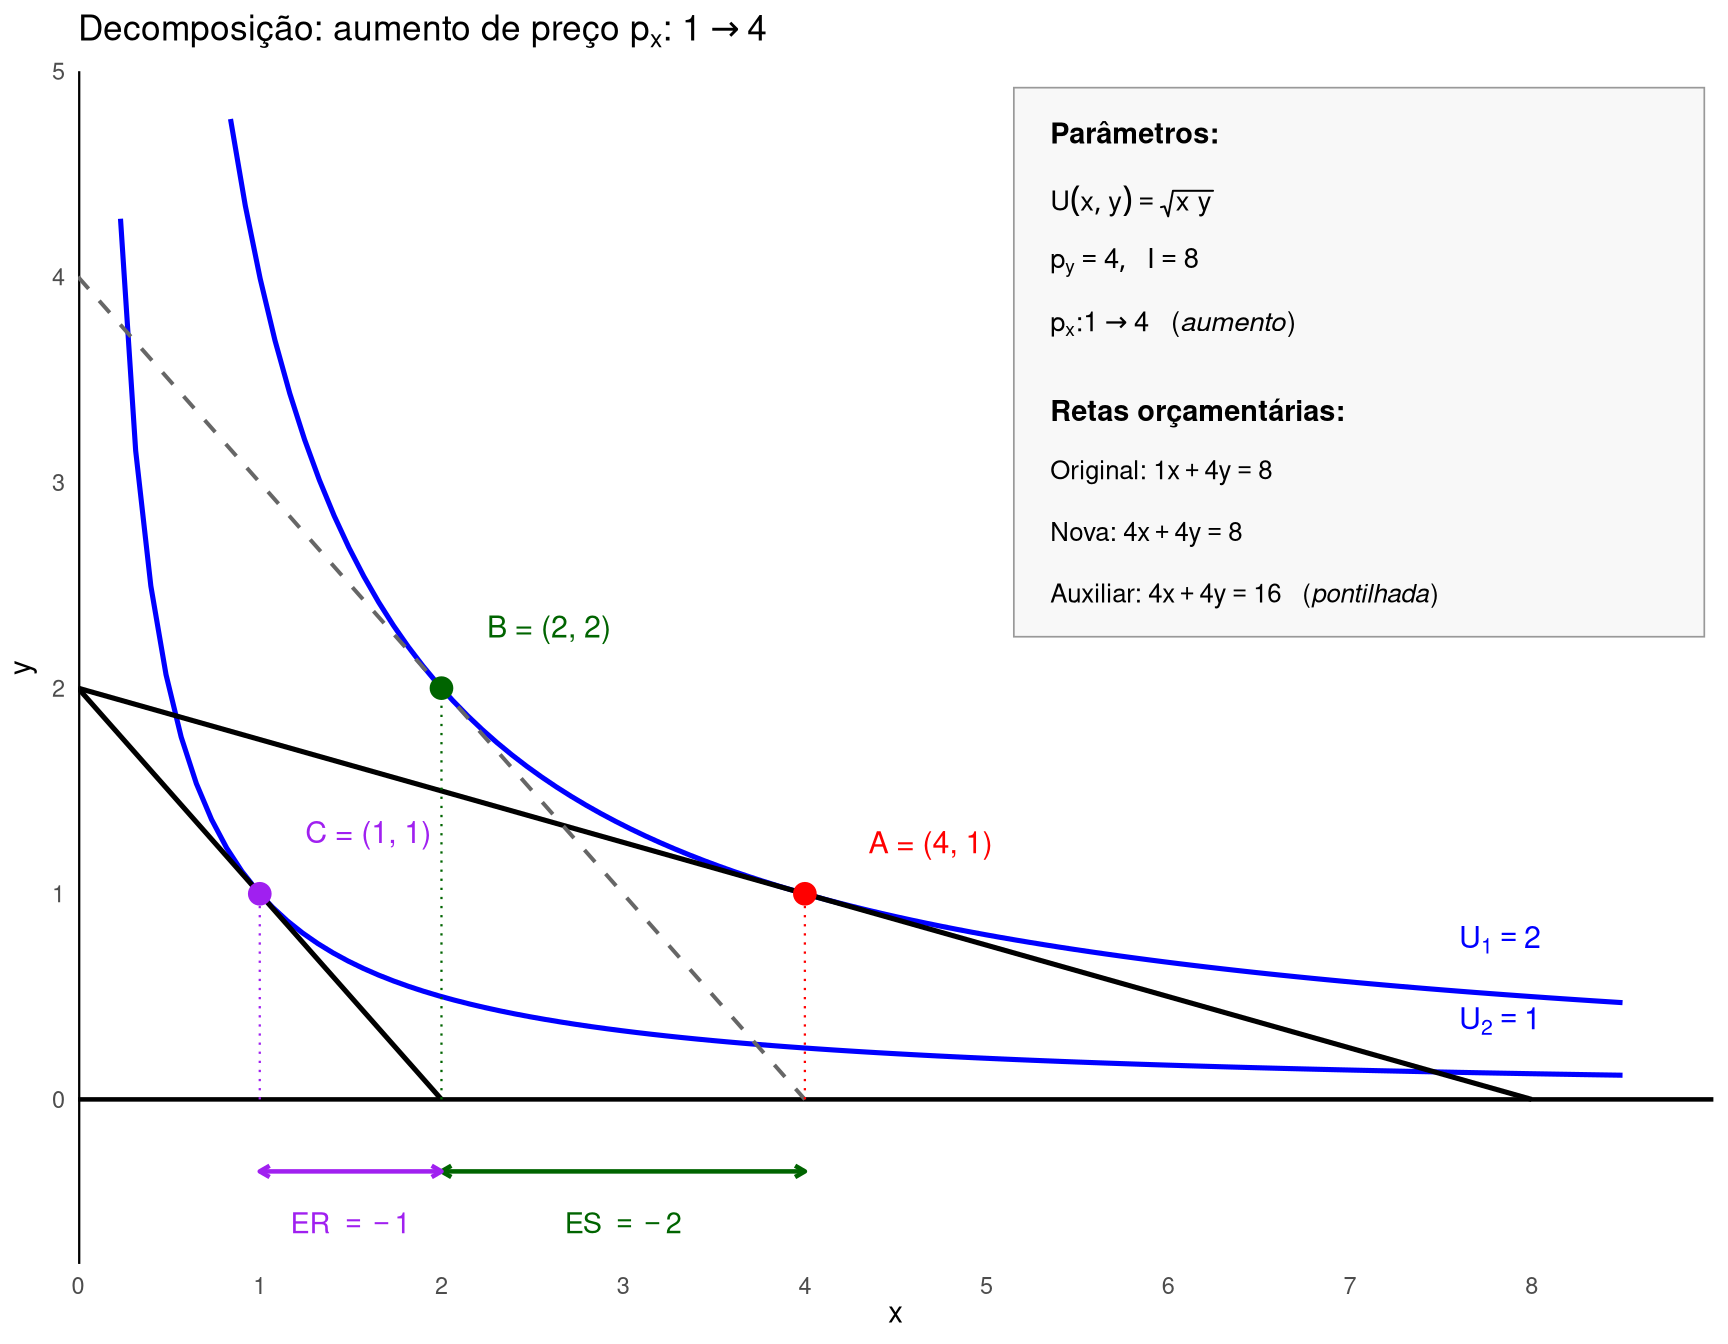
Cenário: Cobb-Douglas \(U(x, y) = x^{0{,}5} y^{0{,}5}\), com \(p_y = 4\) e \(I = 8\). O preço \(p_x\)sobe de \(1\) para \(4\).
Passo 1 — cesta inicial (ponto \(A\)). Com \(p_x = 1\), \(p_y = 4\), \(I = 8\), aplicamos as demandas Marshallianas Cobb-Douglas \(x^* = 0{,}5 \, I / p_x\) e \(y^* = 0{,}5 \, I / p_y\) (derivadas em Note 5.2):
Portanto \(A = (4, 1)\) está sobre a curva de indiferença \(U_1 = 2\), dada por \(y = 4/x\).
Passo 2 — cesta auxiliar (ponto \(B\)). Denote por \((x_B, y_B)\) as quantidades consumidas de \(x\) e \(y\) no ponto \(B\). Este ponto é definido geometricamente como a tangência entre a curva de indiferença original\(U_1 = 2\) e uma reta orçamentária com a nova inclinação \(-p_x'/p_y\). Para localizá-lo, impomos duas condições simultâneas:
tangência aos novos preços: \(TMS = p_x'/p_y\), onde \(p_x' = 4\) é o novo preço;
utilidade constante em \(U_1\): \(U(x_B, y_B) = U_1\).
Para a Cobb-Douglas \(U = x^{0{,}5} y^{0{,}5}\), a taxa marginal de substituição em um par genérico \((x, y)\) é \(TMS = U_x/U_y = y/x\) (derivada em Note 5.2). Avaliando em \(B\), temos \(TMS = y_B/x_B\). O sistema fica:
\[\begin{aligned}
\frac{y_B}{x_B} &= \frac{p_x'}{p_y} = \frac{4}{4} = 1 & & \text{(i) tangência em } B \text{ aos novos preços} \\[6pt]
\sqrt{x_B \cdot y_B} &= U_1 = 2 & & \text{(ii) } B \text{ sobre a mesma curva de indiferença que } A
\end{aligned}\]
Da condição (i): \(y_B/x_B = 1 \Rightarrow y_B = x_B\) (as quantidades de \(x\) e \(y\) em \(B\) são iguais). Substituindo esse resultado na condição (ii) e resolvendo passo a passo:
Portanto \(B = (2, 2)\), sobre \(U_1 = 2\) (verificação: \(\sqrt{2 \cdot 2} = 2\) ✓). A reta orçamentária auxiliar é a que passa por \(B\) com inclinação \(-p_x'/p_y = -1\). Aos novos preços, o gasto em \(B\) é \(4 \cdot 2 + 4 \cdot 2 = 16\), de modo que a reta auxiliar é \(4x + 4y = 16\) — correspondente a uma renda compensada hipotética \(I_{aux} = 16\) (comparada à renda original \(I = 8\)).
Passo 3 — cesta final (ponto \(C\)). Aos novos preços e com a renda original\(I = 8\), aplicamos novamente as demandas Marshallianas \(x^*\) e \(y^*\):
\[\begin{aligned}
x^*_C &= \frac{0{,}5 \, I}{p_x} = \frac{0{,}5 \cdot 8}{4} = 1 & & \text{demanda Marshalliana de } x \text{ aos preços novos} \\[6pt]
y^*_C &= \frac{0{,}5 \, I}{p_y} = \frac{0{,}5 \cdot 8}{4} = 1 & & \text{demanda Marshalliana de } y \\[6pt]
U_2 &= \sqrt{x^*_C \cdot y^*_C} = \sqrt{1 \cdot 1} = 1 & & \text{utilidade no ótimo final (inferior a } U_1\text{)}
\end{aligned}\]
Portanto \(C = (1, 1)\) está sobre a curva de indiferença \(U_2 = 1\), dada por \(y = 1/x\). Como esperado para uma alta de preço, \(U_2 < U_1\): o consumidor fica em pior situação.
Passo 4 — decomposição do efeito sobre \(x\):
\[\begin{aligned}
\text{ES} &= x_B - x^*_A = 2 - 4 = -2 & & \text{efeito substituição } (A \to B) \\[6pt]
\text{ER} &= x^*_C - x_B = 1 - 2 = -1 & & \text{efeito renda } (B \to C) \\[6pt]
\text{ET} &= x^*_C - x^*_A = 1 - 4 = -3 & & \text{efeito total } (A \to C)
\end{aligned}\]
Ambos os efeitos são negativos, confirmando que \(x\) é um bem normal na Cobb-Douglas: a alta de preço reduz o consumo de \(x\) tanto pelo canal da substituição (fica relativamente mais caro que \(y\)) quanto pelo canal da renda (a renda real cai, e por ser normal, menos \(x\) é demandado). Os dois efeitos se reforçam, produzindo uma variação total grande (\(-3\) em uma cesta inicial de \(4\), ou seja, uma queda de 75%).
Implementação em R
Código
# Réplica da Fig 5.4 de Nicholson — aumento de preço p_x: 1 -> 4# Curvas de indiferença Cobb-Douglas U = sqrt(xy) => y = U^2/x# U_1 = 2 => y = 4/x (curva original, passa por A = (4,1) e B = (2,2))# U_2 = 1 => y = 1/x (curva final, passa por C = (1,1))# Retas orçamentárias:# Original (p_x=1, p_y=4, I=8): x + 4y = 8 -> de (0,2) a (8,0)# Nova (p_x=4, p_y=4, I=8): 4x + 4y = 8 -> de (0,2) a (2,0)# Auxiliar (novos preços, renda compensada I_aux = 16, tangente a U_1 em B):# 4x + 4y = 16 -> de (0,4) a (4,0)ggplot() +# Eixos explícitos em x = 0 e y = 0 (retas orçamentárias terminam em y = 0,# enquanto o painel se estende até y = -0,8 para acomodar os colchetes ES/ER)geom_hline(yintercept =0, color ="black", linewidth =0.8) +geom_vline(xintercept =0, color ="black", linewidth =0.8) +# Curvas de indiferençageom_function(fun = \(x) 4/ x, xlim =c(0.35, 8.5),color ="blue", linewidth =0.9) +geom_function(fun = \(x) 1/ x, xlim =c(0.15, 8.5),color ="blue", linewidth =0.9) +# Reta orçamentária original: x + 4y = 8geom_segment(aes(x =0, y =2, xend =8, yend =0),color ="black", linewidth =0.9) +# Nova reta orçamentária: 4x + 4y = 8 (mais íngreme)geom_segment(aes(x =0, y =2, xend =2, yend =0),color ="black", linewidth =0.9) +# Reta auxiliar (renda compensada): 4x + 4y = 16, tangente a U_1 em Bgeom_segment(aes(x =0, y =4, xend =4, yend =0),color ="gray40", linewidth =0.7, linetype ="dashed") +# Pontos A, B, Cgeom_point(aes(x =4, y =1), color ="red", size =3.5) +geom_point(aes(x =2, y =2), color ="darkgreen", size =3.5) +geom_point(aes(x =1, y =1), color ="purple", size =3.5) +# Rótulos dos pontosannotate("text", x =4.35, y =1.25, label ="A = (4, 1)",color ="red", size =4, hjust =0) +annotate("text", x =2.25, y =2.30, label ="B = (2, 2)",color ="darkgreen", size =4, hjust =0) +annotate("text", x =1.25, y =1.30, label ="C = (1, 1)",color ="purple", size =4, hjust =0) +# Rótulos das curvas de indiferençaannotate("text", x =7.6, y =4/7.6+0.25,label = latex2exp::TeX(r"($U_1 = 2$)"),color ="blue", size =4, hjust =0) +annotate("text", x =7.6, y =1/7.6+0.25,label = latex2exp::TeX(r"($U_2 = 1$)"),color ="blue", size =4, hjust =0) +# Caixa com parâmetros do exercício no canto superior direitoannotate("rect", xmin =5.15, xmax =8.95,ymin =2.25, ymax =4.92,fill ="grey97", color ="grey60",linewidth =0.3, alpha =0.9) +annotate("text", x =5.35, y =4.70,label ="Parâmetros:",hjust =0, size =3.8, fontface ="bold") +annotate("text", x =5.35, y =4.37,label = latex2exp::TeX(r"($U(x, y) = \sqrt{x \, y}$)"),hjust =0, size =3.6) +annotate("text", x =5.35, y =4.07,label = latex2exp::TeX(r"($p_y = 4, \; I = 8$)"),hjust =0, size =3.6) +annotate("text", x =5.35, y =3.77,label = latex2exp::TeX(r"($p_x: 1 \rightarrow 4$ \ (\it{aumento}))"),hjust =0, size =3.6) +annotate("text", x =5.35, y =3.35,label ="Retas orçamentárias:",hjust =0, size =3.8, fontface ="bold") +annotate("text", x =5.35, y =3.05,label = latex2exp::TeX(r"(Original: $1x + 4y = 8$)"),hjust =0, size =3.4) +annotate("text", x =5.35, y =2.75,label = latex2exp::TeX(r"(Nova: $4x + 4y = 8$)"),hjust =0, size =3.4) +annotate("text", x =5.35, y =2.45,label = latex2exp::TeX(r"(Auxiliar: $4x + 4y = 16$ \ (\it{pontilhada}))"),hjust =0, size =3.4) +# Projeções tracejadas dos pontos até o eixo xgeom_segment(aes(x =1, y =0, xend =1, yend =1),color ="purple", linewidth =0.4, linetype ="dotted") +geom_segment(aes(x =2, y =0, xend =2, yend =2),color ="darkgreen", linewidth =0.4, linetype ="dotted") +geom_segment(aes(x =4, y =0, xend =4, yend =1),color ="red", linewidth =0.4, linetype ="dotted") +# Colchete ES: de x_B = 2 a x*_A = 4 (efeito substituição)annotate("segment", x =2, xend =4, y =-0.35, yend =-0.35,color ="darkgreen", linewidth =0.8,arrow =arrow(ends ="both", length =unit(0.15, "cm"))) +annotate("text", x =3, y =-0.60,label = latex2exp::TeX(r"(ES $= -2$)"),color ="darkgreen", size =3.8) +# Colchete ER: de x*_C = 1 a x_B = 2 (efeito renda)annotate("segment", x =1, xend =2, y =-0.35, yend =-0.35,color ="purple", linewidth =0.8,arrow =arrow(ends ="both", length =unit(0.15, "cm"))) +annotate("text", x =1.5, y =-0.60,label = latex2exp::TeX(r"(ER $= -1$)"),color ="purple", size =3.8) +scale_x_continuous(expand =c(0, 0),limits =c(0, 9),breaks =seq(0, 8, 1) ) +scale_y_continuous(expand =c(0, 0),limits =c(-0.8, 5),breaks =seq(0, 5, 1) ) +labs(x = latex2exp::TeX(r"($x$)"),y = latex2exp::TeX(r"($y$)"),title = latex2exp::TeX(r"(Decomposição: aumento de preço $p_x$: $1 \to 4$)") ) +theme_minimal() +theme(axis.line =element_blank(),panel.grid =element_blank() )
Interpretação
No Cobb-Douglas acima, ES e ER têm o mesmo sinal (ambos negativos), resultado típico de bens normais: os dois canais se reforçam e a demanda Marshalliana fica descendente. Para bens inferiores, o ER inverte de sinal e atenua parcialmente o ES, mas o efeito total permanece quase sempre negativo; a demanda simplesmente responde menos a preços.
O caso extremo é o bem Giffen, que exige três condições simultâneas: (i) inferioridade, (ii) participação alta no orçamento e (iii) ER maior que ES em magnitude. A atribuição clássica (Robert Giffen, 1837–1910) associa esse padrão ao consumo de batata na Irlanda durante a fome de 1845–1849, mas reanálises modernas consideram a evidência empírica frágil. O caso mais sólido documentado é o de Jensen e Miller (2008), sobre arroz e trigo em regiões rurais da China.
A análise gráfica deste callout trata de variações discretas de preço. Para variações infinitesimais, a mesma lógica se formaliza na equação de Slutsky (Note 5.6), que expressa \(\partial x/\partial p_x\) como soma dos componentes de substituição e renda sem recorrer à cesta auxiliar. A decomposição também motiva a distinção entre as duas formas de demanda: a Marshalliana (Note 5.4), que mantém a renda fixa e incorpora ambos os efeitos, e a Hicksiana (Note 5.5), que mantém a utilidade fixa e isola o efeito substituição.
Note 5.4: Curva de demanda individual (Marshalliana)
Símbolo
Significado
\(x^*(p_x; \bar{p}_y, \bar{I})\)
curva de demanda individual (com \(p_y\) e \(I\) fixos)
Marshalliana / ordinária
demanda obtida do problema primal de maximização de utilidade
\(\partial x^*/\partial p_x\)
inclinação da curva; \(< 0\) para bens normais (e inferiores comuns)
movimento ao longo
apenas \(p_x\) varia — consumidor desliza sobre a mesma curva
deslocamento
mudança em \(\bar{p}_y\), \(\bar{I}\) ou preferências — a curva toda se move
Desenvolvimento Teórico
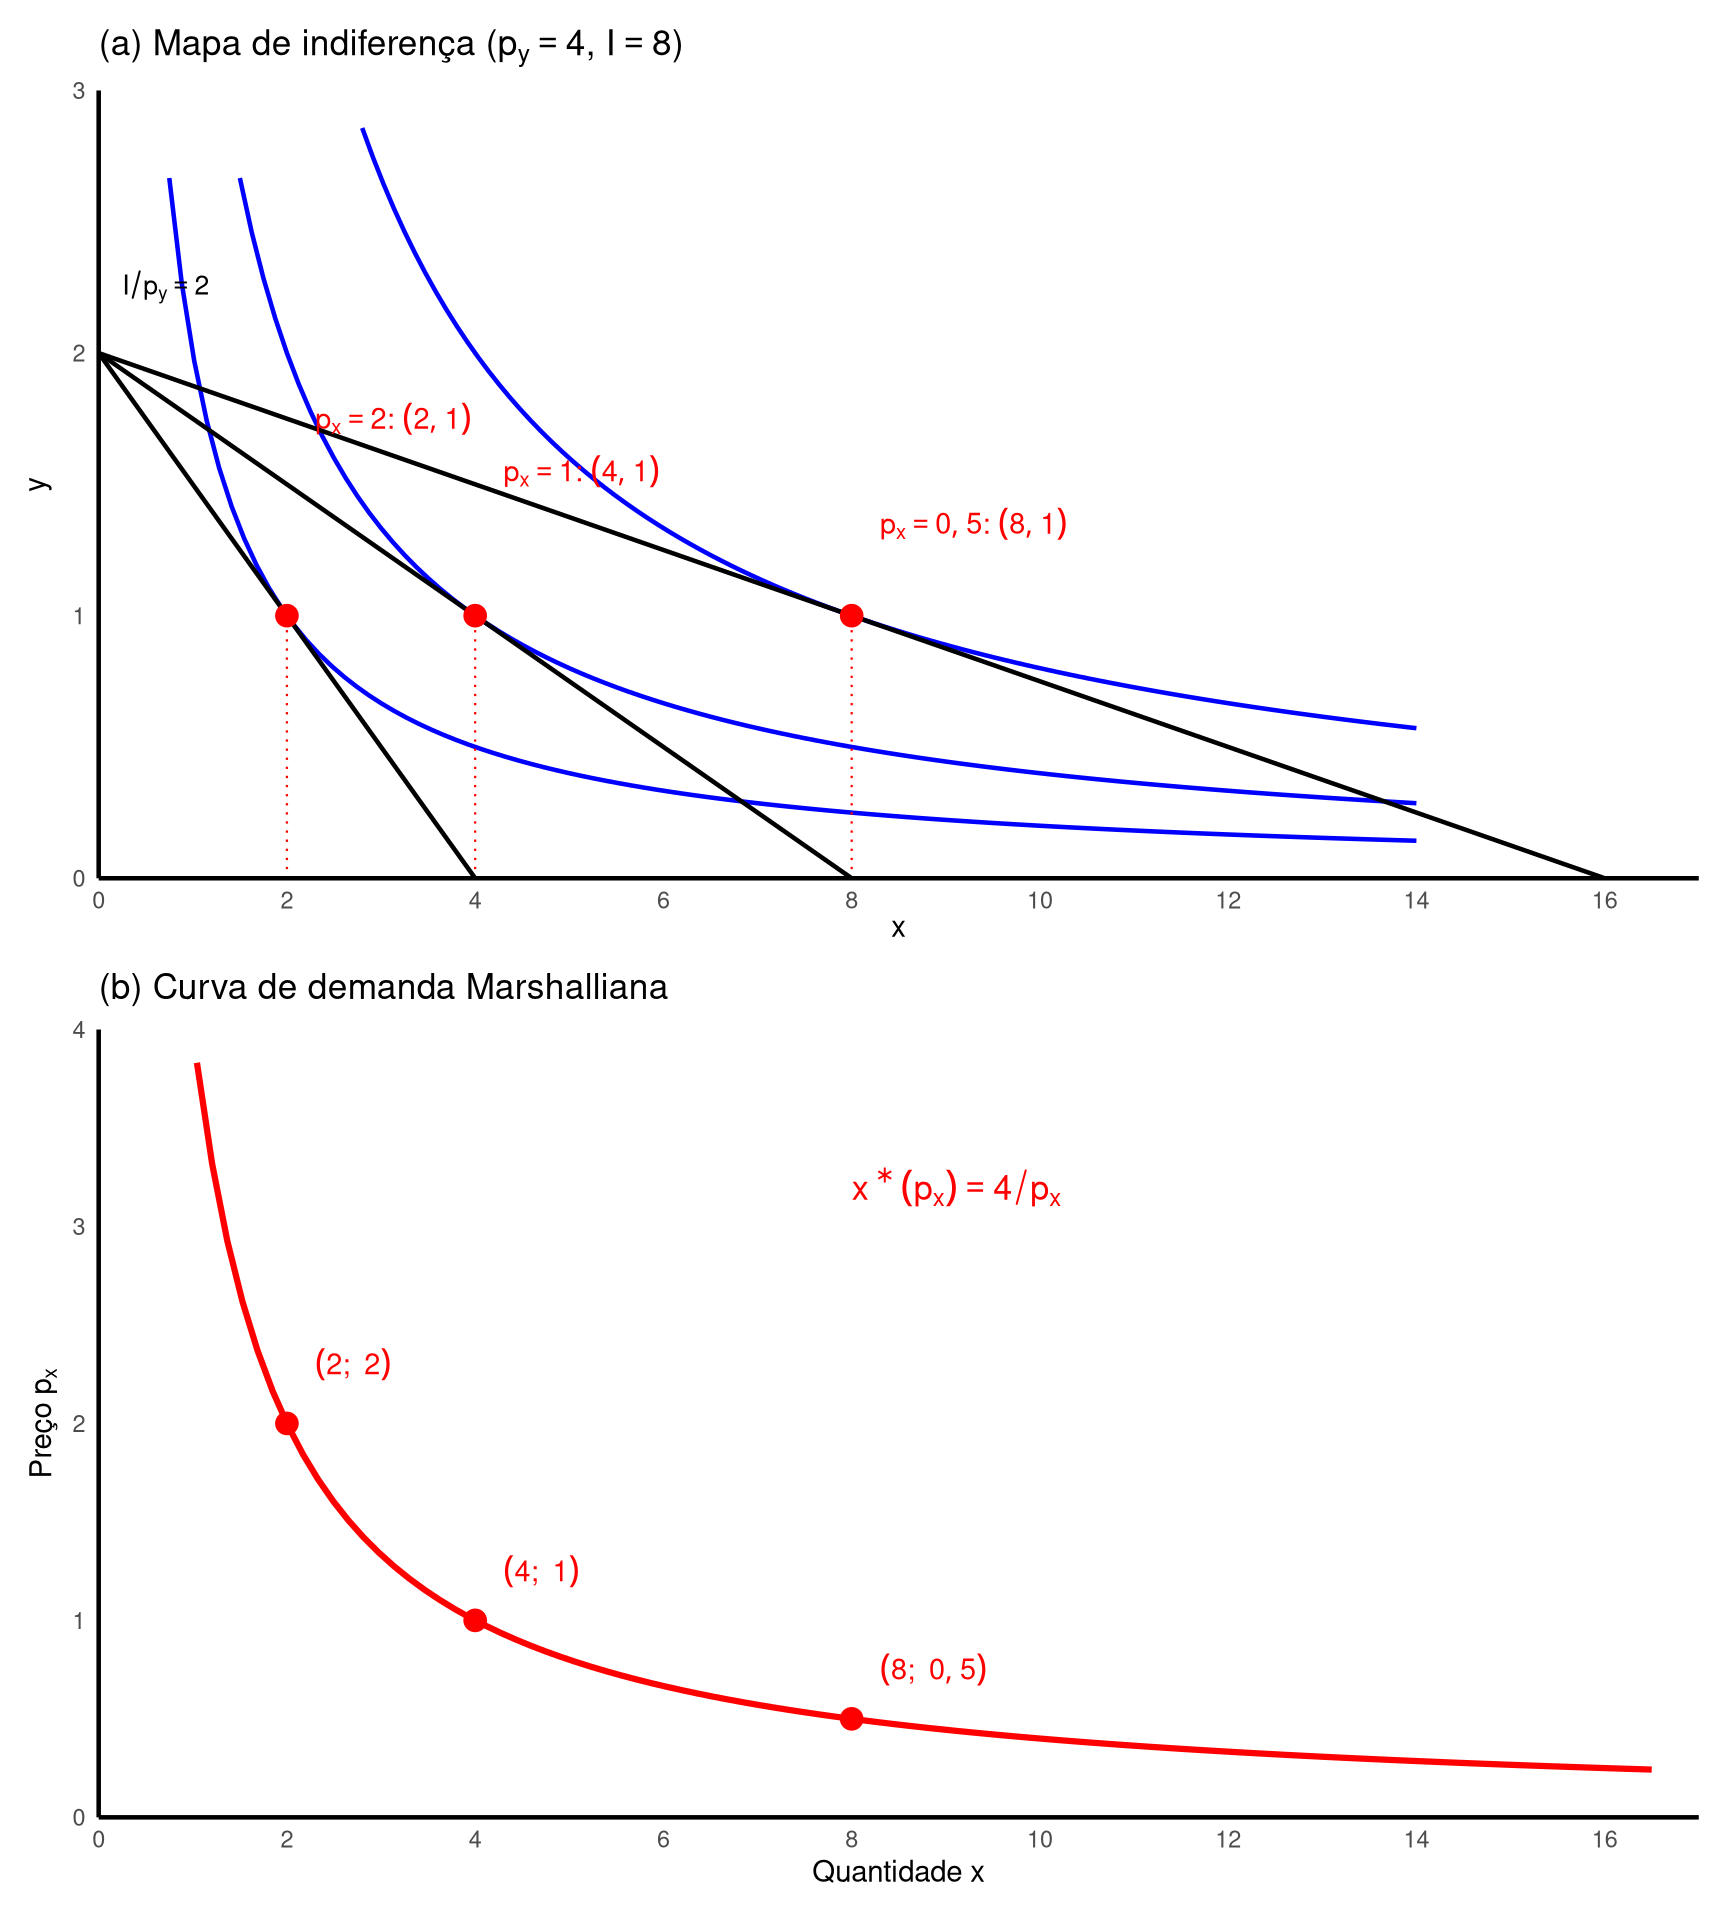
A curva de demanda individual do bem \(x\) relaciona o preço \(p_x\) à quantidade ótima \(x^*\), mantendo constantes \(\bar{p}_y\), \(\bar{I}\) e as preferências. Formalmente, é a função \(x^*(p_x; \bar{p}_y, \bar{I})\), uma seção da demanda Marshalliana completa \(x^*(p_x, p_y, I)\) em que apenas o primeiro argumento varia (Nicholson e Snyder, 2012).
Operacionalmente, constrói-se a curva repetindo a maximização para diferentes valores de \(p_x\): cada preço produz uma nova reta orçamentária (intercepto vertical fixo \(\bar{I}/\bar{p}_y\) e horizontal variável \(\bar{I}/p_x\)), uma nova tangência e, portanto, uma nova cesta ótima. Projetando cada par \((p_x, x^*)\) no plano preço-quantidade obtém-se a curva. A Fig. 5.5 de Nicholson e Snyder (2012) ilustra a construção em dois painéis: mapa de indiferença acima, curva de demanda abaixo.
Exercício Resolvido
Cenário: Cobb-Douglas \(U(x, y) = x^{0{,}5} y^{0{,}5}\), com \(p_y = 4\) e \(I = 8\) fixos. Queremos obter a curva de demanda \(x^*(p_x)\) variando apenas \(p_x\).
A curva \(x^*(p_x) = 4/p_x\) é uma hipérbole retangular no plano preço-quantidade. Observe, além disso, uma característica peculiar da Cobb-Douglas: o gasto com \(x\) é constante, independentemente do preço:
Ou seja, o consumidor sempre destina metade de sua renda ao bem \(x\) — seja \(p_x\) alto ou baixo. Dito de outro modo: a elasticidade-preço da demanda é unitária em toda a curva. Quando \(p_x\) dobra, \(x^*\) cai pela metade; quando \(p_x\) cai pela metade, \(x^*\) dobra — e o produto \(p_x x^*\) permanece em \(4\).
O mesmo raciocínio aplicado a \(y\) mostra que \(y^* = 0{,}5 \cdot 8 / 4 = 1\)não depende de \(p_x\) — a demanda por \(y\) é invariante ao preço de \(x\). Esse é outro reflexo da Cobb-Douglas: os dois bens não são substitutos nem complementos (as elasticidades-preço cruzadas são nulas).
Tabela de pares \((p_x, x^*, y^*,\) gasto\()\):
\(p_x\)
\(x^* = 4/p_x\)
\(y^*\)
Gasto em \(x\): \(p_x x^*\)
Gasto em \(y\): \(p_y y^*\)
0,5
8
1
4
4
1
4
1
4
4
2
2
1
4
4
4
1
1
4
4
Em todos os cenários o consumidor destina \(4\) unidades monetárias a cada bem — é exatamente a fração de gasto constante (\(\alpha = 1 - \alpha = 0{,}5\)) que caracteriza a Cobb-Douglas.
Implementação em R
Código
# Réplica da Fig 5.5 de Nicholson — derivação da curva de demanda Marshalliana.# Cobb-Douglas U = sqrt(xy), com p_y = 4, I = 8 fixos; p_x varia em {0,5; 1; 2}.# Demandas: x* = 0,5*I/p_x = 4/p_x ; y* = 0,5*I/p_y = 1 (constante!)## Pontos ótimos no mapa (x, y):# p_x = 0,5 => (x*, y*) = (8, 1) ; U = sqrt(8) ≈ 2,83 => curva y = 8/x# p_x = 1 => (x*, y*) = (4, 1) ; U = 2 => curva y = 4/x# p_x = 2 => (x*, y*) = (2, 1) ; U = sqrt(2) ≈ 1,41 => curva y = 2/x## Retas orçamentárias (rotacionando em torno de (0, I/p_y) = (0, 2)):# p_x = 0,5 => de (0, 2) a (16, 0)# p_x = 1 => de (0, 2) a (8, 0)# p_x = 2 => de (0, 2) a (4, 0)# Painel (a): mapa de indiferença com 3 retas orçamentárias e 3 tangênciasp_a <-ggplot() +# Curvas de indiferença (uma para cada nível de utilidade ótima)geom_function(fun = \(x) 8/ x, xlim =c(2.8, 14),color ="blue", linewidth =0.8) +geom_function(fun = \(x) 4/ x, xlim =c(1.5, 14),color ="blue", linewidth =0.8) +geom_function(fun = \(x) 2/ x, xlim =c(0.75, 14),color ="blue", linewidth =0.8) +# Retas orçamentárias (rotação em torno de (0, 2))geom_segment(aes(x =0, y =2, xend =16, yend =0),color ="black", linewidth =0.8) +geom_segment(aes(x =0, y =2, xend =8, yend =0),color ="black", linewidth =0.8) +geom_segment(aes(x =0, y =2, xend =4, yend =0),color ="black", linewidth =0.8) +# Pontos ótimos (todos com y* = 1)geom_point(aes(x =c(8, 4, 2), y =c(1, 1, 1)),color ="red", size =3.5) +# Projeções verticais dos pontos ótimos até o eixo xgeom_segment(aes(x =8, y =0, xend =8, yend =1),color ="red", linewidth =0.4, linetype ="dotted") +geom_segment(aes(x =4, y =0, xend =4, yend =1),color ="red", linewidth =0.4, linetype ="dotted") +geom_segment(aes(x =2, y =0, xend =2, yend =1),color ="red", linewidth =0.4, linetype ="dotted") +# Rótulos dos pontos ótimosannotate("text", x =8.3, y =1.35,label = latex2exp::TeX(r"($p_x = 0{,}5$: $(8, 1)$)"),size =3.8, color ="red", hjust =0) +annotate("text", x =4.3, y =1.55,label = latex2exp::TeX(r"($p_x = 1$: $(4, 1)$)"),size =3.8, color ="red", hjust =0) +annotate("text", x =2.3, y =1.75,label = latex2exp::TeX(r"($p_x = 2$: $(2, 1)$)"),size =3.8, color ="red", hjust =0) +# Rótulo do intercepto vertical comumannotate("text", x =0.25, y =2.25,label = latex2exp::TeX(r"($I/p_y = 2$)"),size =3.5, hjust =0) +scale_x_continuous(expand =c(0, 0),limits =c(0, 17),breaks =c(0, 2, 4, 6, 8, 10, 12, 14, 16) ) +scale_y_continuous(expand =c(0, 0),limits =c(0, 3),breaks =seq(0, 3, 1) ) +labs(x = latex2exp::TeX(r"($x$)"),y = latex2exp::TeX(r"($y$)"),title = latex2exp::TeX(r"((a) Mapa de indiferença ($p_y = 4$, $I = 8$))") ) +theme_minimal() +theme(axis.line =element_line(color ="black", linewidth =0.8),panel.grid =element_blank() )# Painel (b): curva de demanda Marshalliana no plano (x, p_x).# x*(p_x) = 4/p_x <=> p_x = 4/x no plano com p_x no eixo vertical.# Três pontos: (x, p_x) = (8; 0,5), (4; 1), (2; 2).# Eixo x alinhado ao painel (a): 0 a 17, breaks a cada 2.p_b <-ggplot() +geom_function(fun = \(x) 4/ x, xlim =c(0.4, 16.5),color ="red", linewidth =1.1) +geom_point(aes(x =c(8, 4, 2), y =c(0.5, 1, 2)),color ="red", size =3.5) +# Rótulos dos pontosannotate("text", x =8.3, y =0.75,label = latex2exp::TeX(r"($(8;\ 0{,}5)$)"),size =3.8, color ="red", hjust =0) +annotate("text", x =4.3, y =1.25,label = latex2exp::TeX(r"($(4;\ 1)$)"),size =3.8, color ="red", hjust =0) +annotate("text", x =2.3, y =2.30,label = latex2exp::TeX(r"($(2;\ 2)$)"),size =3.8, color ="red", hjust =0) +# Equação da curvaannotate("text", x =8, y =3.2,label = latex2exp::TeX(r"($x^*(p_x) = 4/p_x$)"),size =4.5, color ="red", hjust =0) +scale_x_continuous(expand =c(0, 0),limits =c(0, 17),breaks =c(0, 2, 4, 6, 8, 10, 12, 14, 16) ) +scale_y_continuous(expand =c(0, 0),limits =c(0, 4),breaks =seq(0, 4, 1) ) +labs(x = latex2exp::TeX(r"(Quantidade $x$)"),y = latex2exp::TeX(r"(Preço $p_x$)"),title = latex2exp::TeX(r"((b) Curva de demanda Marshalliana)") ) +theme_minimal() +theme(axis.line =element_line(color ="black", linewidth =0.8),panel.grid =element_blank() )# Empilhar verticalmente (p_a em cima, p_b embaixo)p_a / p_b
Interpretação
A inclinação descendente da curva de demanda é consequência direta da maximização de utilidade sob preferências convexas, não um postulado adicional da teoria. Para bens normais, efeito substituição e efeito renda (Note 5.3) têm o mesmo sinal e se reforçam. Para bens inferiores comuns, o ES ainda domina o ER invertido, e a demanda segue descendente. Apenas no caso Giffen a inclinação se inverte, situação empiricamente rara.
A curva Cobb-Douglas é uma hipérbole retangular (\(p_x x^* = 4\)), consequência direta da fração de gasto constante (\(\alpha/(\alpha+\beta) = 0{,}5\)); equivale a dizer que a elasticidade-preço é unitária em todo ponto. Formas como CES ou Stone-Geary produzem elasticidades variáveis ao longo da curva. Vale também distinguir variação da quantidade demandada (movimento ao longo da curva, só \(p_x\) muda) de variação da demanda (deslocamento provocado por mudanças em \(\bar{I}\), \(\bar{p}_y\) ou preferências). Pela homogeneidade de grau zero (Note 5.1), uma variação proporcional em \(\bar{I}\) e \(\bar{p}_y\) não desloca a curva.
A Marshalliana incorpora ambos os efeitos, substituição e renda. A Hicksiana (Note 5.5), objeto do próximo callout, isola apenas a substituição, respondendo “quanto de \(x\) o consumidor demandaria a cada preço se fosse compensado para manter a mesma utilidade?”. A diferença vertical entre as duas curvas, no plano preço-quantidade, é o efeito renda.
Note 5.5: Demanda compensada (Hicksiana) e lema de Shephard
Símbolo
Significado
\(x^c(p_x, p_y, U)\)
demanda compensada (Hicksiana) do bem \(x\)
\(E(p_x, p_y, U)\)
função de despesa mínima para atingir a utilidade \(U\)
\(\mathscr{L} = p_x x + p_y y + \lambda[\bar{U} - U(x,y)]\)
Lagrangiana do problema dual
\(\partial E/\partial p_x = x^c\)
lema de Shephard
Desenvolvimento Teórico
Para cada problema de maximização há um dual simétrico de minimização. No consumidor, o primal é a maximização de utilidade sujeita à restrição orçamentária; o dual é a minimização da despesa sujeita a uma restrição de utilidade mínima. Formalmente,
\[\min_{x, y} \; p_x x + p_y y \quad \text{s.a.} \quad U(x, y) \geq \bar{U}.\]
Sua solução define a demanda compensada (Hicksiana) \(x^c(p_x, p_y, \bar{U})\), e o valor mínimo da função objetivo no ótimo é a função de despesa \(E(p_x, p_y, \bar{U}) = p_x x^c + p_y y^c\). Enquanto a Marshalliana tem a renda \(I\) como argumento, a Hicksiana tem a utilidade \(\bar{U}\) — é essa diferença que isola o efeito substituição: ao variar \(p_x\) com \(\bar{U}\) fixo, a renda é ajustada implicitamente para manter o consumidor na mesma curva de indiferença, e a variação da cesta reflete apenas a mudança nos preços relativos. As Figs. 5.6 e 5.7 de Nicholson e Snyder (2012) ilustram a derivação geométrica e a comparação com a Marshalliana.
A Lagrangiana do dual é
\[\mathscr{L} = p_x x + p_y y + \lambda[\bar{U} - U(x, y)],\]
e as condições de primeira ordem produzem \(x^c\) e \(y^c\) em função de \((p_x, p_y, \bar{U})\). Na prática, é raro resolver o dual diretamente: o caminho eficiente começa pela função de despesa \(E(p_x, p_y, U)\) e aplica o lema de Shephard.
Lema de Shephard — enunciado, intuição e utilidade prática
O lema de Shephard é um atalho analítico para obter a demanda Hicksiana a partir da função de despesa, sem resolver o Lagrangiano do problema dual. Ele afirma que a derivada da função de despesa em relação ao preço de um bem é a própria função de demanda compensada daquele bem:
Em outras palavras: se conhecemos a função de despesa \(E(p_x, p_y, U)\), basta derivá-la em \(p_x\) para obter diretamente a curva de demanda Hicksiana de \(x\), expressa como função dos preços e da utilidade. Não é apenas um valor numérico pontual: o resultado \(\partial E/\partial p_x\) já é a função \(x^c(p_x, p_y, U)\) válida para quaisquer \((p_x, p_y, U)\).
Intuição. Quando \(p_x\) aumenta, há dois efeitos sobre a despesa total. O efeito direto: cada unidade de \(x\) já consumida fica mais cara, somando \(x^c\) à despesa. O efeito indireto: o consumidor reotimiza a cesta, realocando consumo entre \(x\) e \(y\) para manter a mesma utilidade \(\bar{U}\). O lema diz que, no ponto ótimo, o efeito indireto é zero: a reotimização não gera ganho nem perda em primeira ordem, porque a cesta inicial já era ótima. Resta apenas o efeito direto, \(x^c\).
Para que serve na prática:
Se \(E\) já é conhecida, obtém-se \(x^c\) por uma simples derivada, evitando resolver o sistema de CPOs do dual.
Garante que a demanda compensada tem inclinação não-positiva (\(\partial x^c/\partial p_x = \partial^2 E/\partial p_x^2 \leq 0\)), consequência da concavidade de \(E\) em preços.
Conecta diretamente a função de despesa (observável em princípio) às quantidades demandadas, o que é a base para medidas de bem-estar como variação compensatória e equivalente.
No problema primal (maximização de utilidade), o resultado análogo é a identidade de Roy: \(x^* = -(\partial V/\partial p_x) / (\partial V/\partial I)\), onde \(V\) é a utilidade indireta. Ambos são casos do teorema do envelope aplicado a problemas de otimização condicionada.
Este é um caso particular do teorema do envelope(Nicholson e Snyder, 2012): ao derivar uma função de valor (aqui, \(E\)) em relação a um parâmetro (aqui, \(p_x\)), os ajustes endógenos ótimos (aqui, em \(x^c\) e \(y^c\)) cancelam-se mutuamente, restando apenas a derivada parcial direta da Lagrangiana em relação ao parâmetro.
Sentido econômico. Quando \(p_x\) sobe marginalmente, o consumidor sofre dois impactos. Primeiro, cada unidade de \(x\) que ele já consome fica mais cara, acrescentando \(x^c\) à despesa total (efeito direto). Segundo, ele reotimiza a cesta: compra menos \(x\) e mais \(y\) para continuar atingindo \(\bar{U}\) ao menor custo possível (efeito indireto). Mas essa reotimização é uma resposta de alguém que já estava no ótimo: qualquer troca marginal entre \(x\) e \(y\) ao longo da curva de indiferença \(\bar{U}\) não gera economia líquida, porque na tangência o custo marginal de substituir \(x\) por \(y\) é exatamente igual ao preço relativo. A reotimização, portanto, não altera a despesa em primeira ordem. O resultado prático é que, para prever quanto a despesa mínima muda com uma pequena variação de preço, basta multiplicar a variação pela quantidade atualmente consumida do bem, sem precisar recalcular toda a cesta ótima.
Propriedades da função de despesa
Do lema de Shephard seguem duas propriedades que são usadas repetidamente na análise da demanda Hicksiana:
\(E\) é não-decrescente em preços. Aumentos de preço nunca reduzem o custo mínimo de atingir uma dada utilidade, o que implica \(x^c = \partial E/\partial p_x \geq 0\) (quantidades compensadas são não-negativas).
\(E\) é côncava em preços. A segunda derivada satisfaz \(\partial^2 E/\partial p_x^2 \leq 0\). Como pelo lema \(\partial E/\partial p_x = x^c\), segue \(\partial x^c/\partial p_x = \partial^2 E/\partial p_x^2 \leq 0\). A inclinação da Hicksiana é, portanto, sempre não-positiva.
Resolução direta via Lagrangiano (caso geral)
Embora o lema de Shephard seja o caminho mais eficiente quando \(E\) é conhecida, a resolução direta via Lagrangiano explicita a estrutura do problema dual e sua relação com o primal.
Passo 1 — Lagrangiana e condições de primeira ordem. Partindo da Lagrangiana \(\mathscr{L} = p_x x + p_y y + \lambda[\bar{U} - U(x, y)]\), igualamos as derivadas parciais a zero:
Esta é a mesma condição de tangência do problema primal (maximização de utilidade sujeita à restrição orçamentária, ver Note 5.4). A diferença entre primal e dual está na terceira equação do sistema:
Problema
CPO 1 e 2 (tangência)
CPO 3 (restrição)
Primal (max utilidade)
\(TMS = p_x / p_y\)
\(p_x x + p_y y = I\)
Dual (min despesa)
\(TMS = p_x / p_y\)
\(U(x, y) = \bar{U}\)
Passo 3 — sistema de equações. O sistema a resolver é:
\[\begin{cases}
U_x / U_y = p_x / p_y & \text{(tangência: inclinação da CI = inclinação da reta)} \\
U(x, y) = \bar{U} & \text{(utilidade fixa no nível de referência)}
\end{cases}\]
São 2 equações e 2 incógnitas (\(x^c\) e \(y^c\)). A solução produz as demandas compensadas \(x^c(p_x, p_y, \bar{U})\) e \(y^c(p_x, p_y, \bar{U})\). A forma funcional concreta depende da especificação de \(U\); o Exercício Resolvido a seguir aplica este procedimento à Cobb-Douglas.
Exercício Resolvido
Cenário: Cobb-Douglas \(U(x, y) = x^{0{,}5} y^{0{,}5}\), preços \(p_x\) e \(p_y\), utilidade-alvo \(\bar{U}\). Resolvemos o problema dual por Lagrangiano e depois verificamos o resultado pelo lema de Shephard.
Resolução via Lagrangiano
Passo 1 — montar o Lagrangiano do problema dual.
\[\mathscr{L} = p_x x + p_y y + \lambda\bigl[\bar{U} - x^{0{,}5} y^{0{,}5}\bigr]\]
\[y = \frac{p_x}{p_y} \, x \qquad \text{(relação de tangência no dual)}\]
Note que esta é a mesma condição \(TMS = p_x/p_y\) obtida na maximização de utilidade. A diferença é que agora a segunda equação é a restrição de utilidade (CPO 3), não a restrição orçamentária.
Passo 4 — substituir na restrição de utilidade (CPO 3) para obter a função de demanda Hicksiana.
Esta é a função de demanda Hicksiana (compensada) de \(x\): expressa a quantidade ótima como função dos preços e do nível de utilidade fixado \(\bar{U}\), válida para quaisquer \((p_x, p_y, U)\). Compare com a Marshalliana \(x^* = 0{,}5 \, I/p_x\) (ver Note 5.4): enquanto a Marshalliana depende da renda \(I\), a Hicksiana depende de \(\bar{U}\).
Por simetria (trocando os papéis de \(x\) e \(y\)), a demanda compensada de \(y\) é \(y^c = p_x^{0{,}5} \, p_y^{-0{,}5} \, U\).
Função de despesa
Substituindo \(x^c\) e \(y^c\) na despesa total:
\[\begin{aligned}
E &= p_x \, x^c + p_y \, y^c & & \text{gasto total na cesta compensada} \\[6pt]
&= p_x \cdot p_x^{-0{,}5} p_y^{0{,}5} U + p_y \cdot p_x^{0{,}5} p_y^{-0{,}5} U & & \text{substituindo } x^c \text{ e } y^c \\[6pt]
&= p_x^{0{,}5} \, p_y^{0{,}5} \, U + p_x^{0{,}5} \, p_y^{0{,}5} \, U & & \text{simplificando expoentes} \\[6pt]
&= 2 \, p_x^{0{,}5} \, p_y^{0{,}5} \, U & & \text{somando os dois termos iguais}
\end{aligned}\]
Este é o resultado que Nicholson e Snyder (2012) apresenta no Exemplo 4.4 como dado; aqui o derivamos a partir do Lagrangiano.
Verificação pelo lema de Shephard
Tendo obtido \(x^c\) pelo Lagrangiano (Passo 4) e \(E\) pela soma \(p_x x^c + p_y y^c\) (acima), podemos verificar a consistência entre os dois resultados aplicando o lema de Shephard, que afirma \(\partial E/\partial p_x = x^c\):
Derivar \(E\) em \(p_x\) entrega exatamente a função de demanda Hicksiana obtida pelo Lagrangiano. As duas rotas (Lagrangiano direto e Shephard via \(E\)) chegam à mesma função, confirmando a consistência.
Rota alternativa: Shephard sem Lagrangiano do dual
Na rota acima, usamos o Lagrangiano do dual para obter \(x^c\) e \(y^c\), depois construímos \(E = p_x x^c + p_y y^c\), e então verificamos \(\partial E/\partial p_x = x^c\) por Shephard. Mas é possível obter \(x^c\)sem nunca montar o Lagrangiano do dual, usando apenas resultados do problema primal (já resolvido em Note 5.4):
Passo 1 — utilidade indireta \(V\) (do primal). Substituindo as demandas Marshallianas \(x^* = 0{,}5 I/p_x\) e \(y^* = 0{,}5 I/p_y\) na função utilidade:
\(V\) responde à pergunta: “qual a máxima utilidade atingível com renda \(I\) aos preços \((p_x, p_y)\)?”.
Passo 2 — inverter \(V\) para obter \(E\). A função de despesa responde à pergunta inversa: “qual a mínima renda para atingir utilidade \(U\)?”. Basta igualar \(V = U\) e isolar \(I\):
\[\begin{aligned}
V(p_x, p_y, I) &= U & & \text{no ótimo, a utilidade indireta atinge o nível } U \\[6pt]
\frac{I}{2 \, p_x^{0{,}5} \, p_y^{0{,}5}} &= U & & \text{substituindo a expressão de } V \\[6pt]
I &= U \cdot 2 \, p_x^{0{,}5} \, p_y^{0{,}5} & & \text{multiplicando ambos os lados por } 2 \, p_x^{0{,}5} \, p_y^{0{,}5} \\[6pt]
E(p_x, p_y, U) &= 2 \, p_x^{0{,}5} \, p_y^{0{,}5} \, U & & \text{renomeando } I \text{ como } E \text{ (renda mínima para atingir } U\text{)}
\end{aligned}\]
Como \(E\) é a renda mínima necessária para atingir \(U\): \(E(p_x, p_y, U) = 2 \, p_x^{0{,}5} \, p_y^{0{,}5} \, U\) — o mesmo resultado obtido pelo Lagrangiano.
A função de demanda Hicksiana foi obtida sem montar nenhum Lagrangiano do dual. O único ingrediente foi a utilidade indireta \(V\) do problema primal (já resolvido) + uma inversão algébrica + uma derivada.
Comparação das duas rotas:
Rota
Passos
Quando usar
Lagrangiano do dual
\(\mathscr{L}\) → CPOs → tangência → resolver sistema → \(x^c\)
Quando \(V\) ou \(E\) não são conhecidas
Shephard via inversão de \(V\)
\(V\) (do primal) → inverter para \(E\) → \(\partial E/\partial p_x = x^c\)
Quando o primal já foi resolvido
A segunda rota é o motivo pelo qual o lema de Shephard é valorizado: transforma o problema dual inteiro em “inverter uma função + derivar”.
Aplicação numérica ao cenário-base
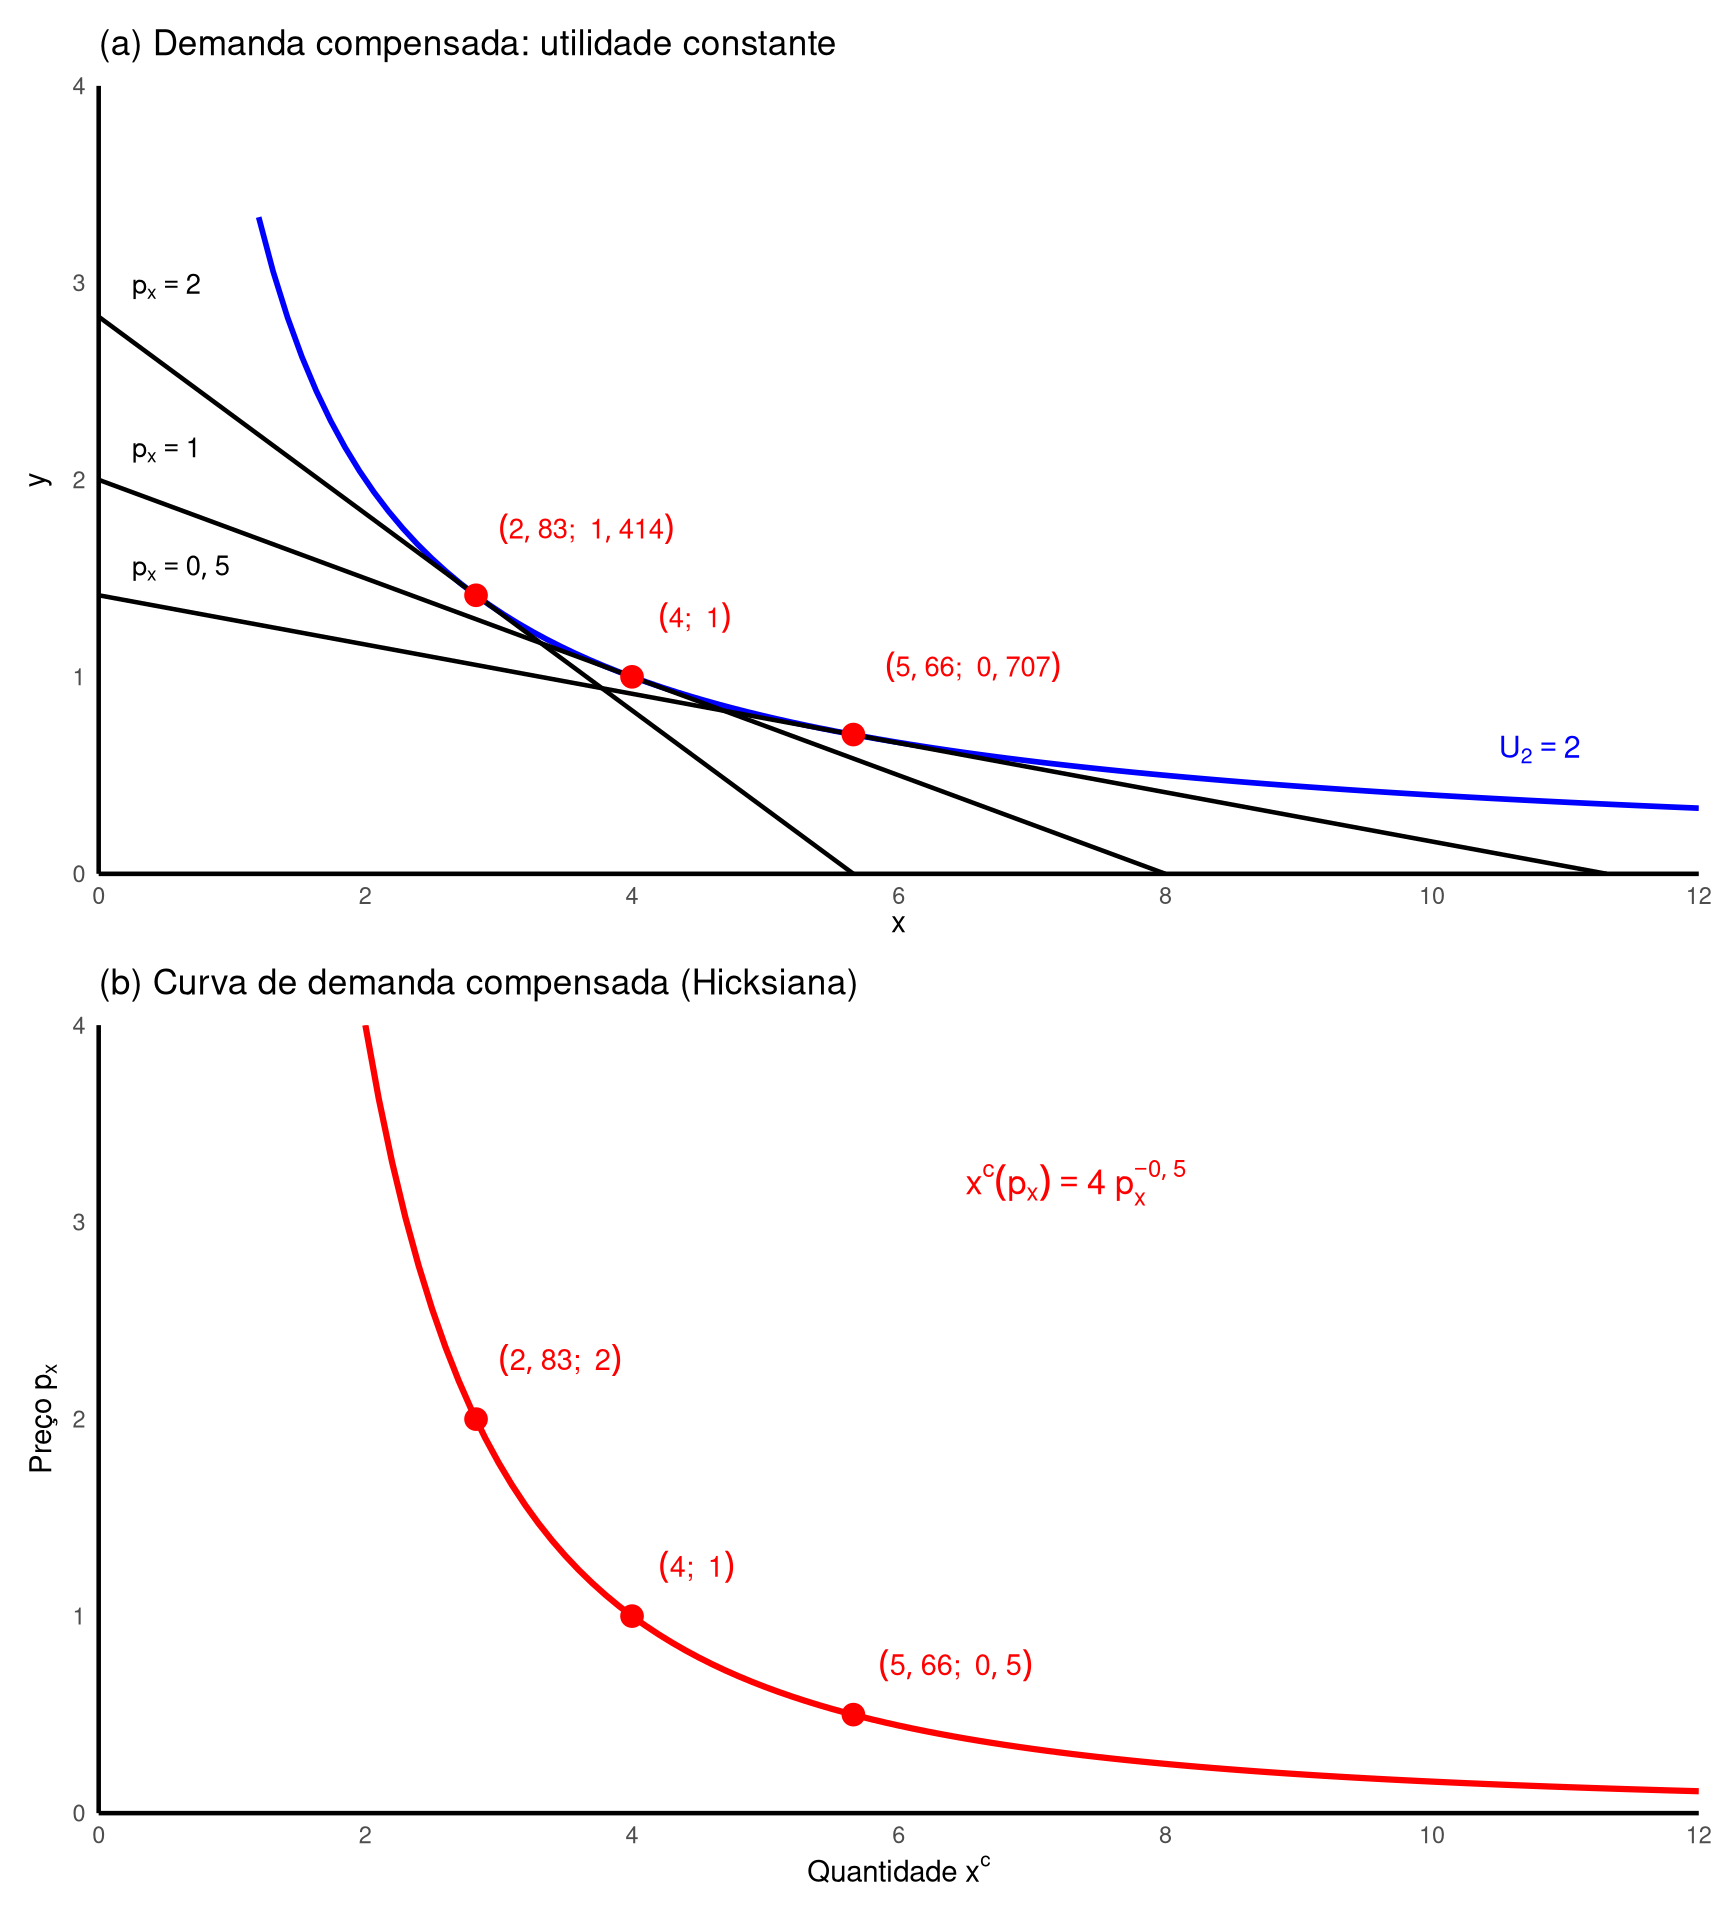
Para o cenário-base do capítulo (\(p_x = 1\), \(p_y = 4\), \(I = 8\)), a maximização de utilidade produz \(x^* = 4\), \(y^* = 1\) e \(U^* = \sqrt{4 \cdot 1} = 2\) (ver Note 5.3). A demanda Hicksiana fixa a utilidade nesse nível de referência \(\bar{U} = 2\). Substituindo \(p_y = 4\) e \(U = 2\) na fórmula geral:
Tabela de pares \((p_x, x^c)\) com \(p_y = 4\) e \(U = 2\):
\(p_x\)
\(x^c = 4/\sqrt{p_x}\)
Valor
0,5
\(4/\sqrt{0{,}5}\)
\(\approx 5{,}66\)
1
\(4/\sqrt{1}\)
\(4\)
2
\(4/\sqrt{2}\)
\(\approx 2{,}83\)
4
\(4/\sqrt{4}\)
\(2\)
Comparando com a Marshalliana \(x^*(p_x) = 4/p_x\) de Note 5.4 — que para os mesmos quatro preços assume \(8, 4, 2, 1\) — observa-se que \(x^c\)varia menos com \(p_x\) do que \(x^*\): quando \(p_x\) passa de \(1\) para \(4\), a Marshalliana cai de \(4\) para \(1\) (redução de 75%), mas a Hicksiana cai apenas de \(4\) para \(2\) (redução de 50%). Essa menor responsividade reflete exatamente a ausência do efeito renda na Hicksiana — tema que será formalizado na equação de Slutsky (Note 5.6).
Implementação em R
Código
# Réplica da Fig 5.6 de Nicholson — derivação da curva de demanda Hicksiana.# Cobb-Douglas U = sqrt(xy), com p_y = 4 e U = 2 fixos; p_x varia em {0,5; 1; 2}.# Demandas compensadas:# x^c(p_x) = p_x^(-0,5) * p_y^(0,5) * U = 4 / sqrt(p_x)# y^c(p_x) = p_x^( 0,5) * p_y^(-0,5) * U = sqrt(p_x)## Pontos de tangência sobre a única curva de indiferença U = 2 (y = 4/x):# p_x = 0,5 => (x^c, y^c) = (5,66; 0,707)# p_x = 1 => (x^c, y^c) = (4; 1)# p_x = 2 => (x^c, y^c) = (2,83; 1,414)## Função de despesa mínima em cada caso (E = 2 sqrt(p_x p_y) U = 8 sqrt(p_x)):# p_x = 0,5 => E = 8 sqrt(0,5) ≈ 5,66 ; reta 0,5 x + 4 y = 5,66# => intercepto x = 11,31 ; y = 1,414# p_x = 1 => E = 8 ; reta x + 4 y = 8# => intercepto x = 8 ; y = 2# p_x = 2 => E = 8 sqrt(2) ≈ 11,31; reta 2 x + 4 y = 11,31# => intercepto x = 5,66 ; y = 2,828# Painel (a): uma curva de indiferença U = 2 com 3 retas orçamentárias tangentesp_a <-ggplot() +# Única curva de indiferença U = 2 (y = 4/x)geom_function(fun = \(x) 4/ x, xlim =c(1.2, 12),color ="blue", linewidth =1) +# Retas orçamentárias de despesa mínima# p_x = 0,5 : 0,5 x + 4 y = 5,66 -> de (0; 1,414) a (11,31; 0)geom_segment(aes(x =0, y =1.414, xend =11.31, yend =0),color ="black", linewidth =0.8) +# p_x = 1 : x + 4 y = 8 -> de (0; 2) a (8; 0)geom_segment(aes(x =0, y =2, xend =8, yend =0),color ="black", linewidth =0.8) +# p_x = 2 : 2 x + 4 y = 11,31 -> de (0; 2,828) a (5,66; 0)geom_segment(aes(x =0, y =2.828, xend =5.66, yend =0),color ="black", linewidth =0.8) +# Pontos de tangência (todos sobre U = 2)geom_point(aes(x =c(5.66, 4, 2.83), y =c(0.707, 1, 1.414)),color ="red", size =3.5) +# Rótulos dos pontos de tangência (deslocados para não sobrepor curvas/retas)annotate("text", x =5.9, y =1.05,label = latex2exp::TeX(r"($(5{,}66;\ 0{,}707)$)"),size =3.6, color ="red", hjust =0) +annotate("text", x =4.20, y =1.30,label = latex2exp::TeX(r"($(4;\ 1)$)"),size =3.6, color ="red", hjust =0) +annotate("text", x =3.00, y =1.75,label = latex2exp::TeX(r"($(2{,}83;\ 1{,}414)$)"),size =3.6, color ="red", hjust =0) +# Rótulos de p_x próximos ao intercepto vertical de cada reta orçamentária# (cada rótulo fica imediatamente acima do respectivo intercepto em y)annotate("text", x =0.25, y =2.98,label = latex2exp::TeX(r"($p_x = 2$)"),size =3.6, hjust =0) +annotate("text", x =0.25, y =2.15,label = latex2exp::TeX(r"($p_x = 1$)"),size =3.6, hjust =0) +annotate("text", x =0.25, y =1.55,label = latex2exp::TeX(r"($p_x = 0{,}5$)"),size =3.6, hjust =0) +# Rótulo da curva de indiferença (à direita, acima da curva)annotate("text", x =10.5, y =4/10.5+0.25,label = latex2exp::TeX(r"($U_2 = 2$)"),color ="blue", size =4, hjust =0) +scale_x_continuous(expand =c(0, 0),limits =c(0, 12),breaks =seq(0, 12, 2) ) +scale_y_continuous(expand =c(0, 0),limits =c(0, 4),breaks =seq(0, 4, 1) ) +labs(x = latex2exp::TeX(r"($x$)"),y = latex2exp::TeX(r"($y$)"),title = latex2exp::TeX(r"((a) Demanda compensada: utilidade constante)") ) +theme_minimal() +theme(axis.line =element_line(color ="black", linewidth =0.8),panel.grid =element_blank() )# Painel (b): curva de demanda Hicksiana no plano (x^c, p_x).# x^c(p_x) = 4 / sqrt(p_x) <=> p_x = 16 / x^2 no plano com p_x no eixo vertical.# Três pontos: (x^c, p_x) = (5,66; 0,5), (4; 1), (2,83; 2).# Eixos alinhados ao painel (a): x de 0 a 12, y de 0 a 4.p_b <-ggplot() +geom_function(fun = \(x) 16/ x^2, xlim =c(2, 12),color ="red", linewidth =1.1) +geom_point(aes(x =c(5.66, 4, 2.83), y =c(0.5, 1, 2)),color ="red", size =3.5) +# Rótulos dos pontosannotate("text", x =5.85, y =0.75,label = latex2exp::TeX(r"($(5{,}66;\ 0{,}5)$)"),size =3.8, color ="red", hjust =0) +annotate("text", x =4.20, y =1.25,label = latex2exp::TeX(r"($(4;\ 1)$)"),size =3.8, color ="red", hjust =0) +annotate("text", x =3.00, y =2.30,label = latex2exp::TeX(r"($(2{,}83;\ 2)$)"),size =3.8, color ="red", hjust =0) +# Equação da curvaannotate("text", x =6.5, y =3.2,label = latex2exp::TeX(r"($x^c(p_x) = 4 \, p_x^{-0{,}5}$)"),size =4.5, color ="red", hjust =0) +scale_x_continuous(expand =c(0, 0),limits =c(0, 12),breaks =seq(0, 12, 2) ) +scale_y_continuous(expand =c(0, 0),limits =c(0, 4),breaks =seq(0, 4, 1) ) +labs(x = latex2exp::TeX(r"(Quantidade $x^c$)"),y = latex2exp::TeX(r"(Preço $p_x$)"),title = latex2exp::TeX(r"((b) Curva de demanda compensada (Hicksiana))") ) +theme_minimal() +theme(axis.line =element_line(color ="black", linewidth =0.8),panel.grid =element_blank() )# Empilhar verticalmente (p_a em cima, p_b embaixo)p_a / p_b
Interpretação
A Hicksiana tem inclinação sempre não-positiva, consequência direta da concavidade da função de despesa em preços: \(\partial x^c/\partial p_x = \partial^2 E/\partial p_x^2 \leq 0\). Como \(x^c\) mantém a utilidade fixa por construção, o único canal ativo é a substituição ao longo de uma curva de indiferença, governada pela convexidade das preferências. A Hicksiana é, portanto, imune ao paradoxo Giffen (Note 5.3): o efeito renda (que gera o paradoxo) simplesmente não existe aqui.
A demanda compensada é a ferramenta natural para análise de bem-estar. Ao medir o ganho ou a perda de utilidade associados a uma mudança de preço (tributação, subsídio, controle de preços), a integral sob a Marshalliana mistura efeitos de substituição com efeitos de poder de compra. A Hicksiana, por manter a utilidade em um nível de referência, fornece medidas limpas: a variação compensatória e a variação equivalente, conceitos retomados em capítulos futuros.
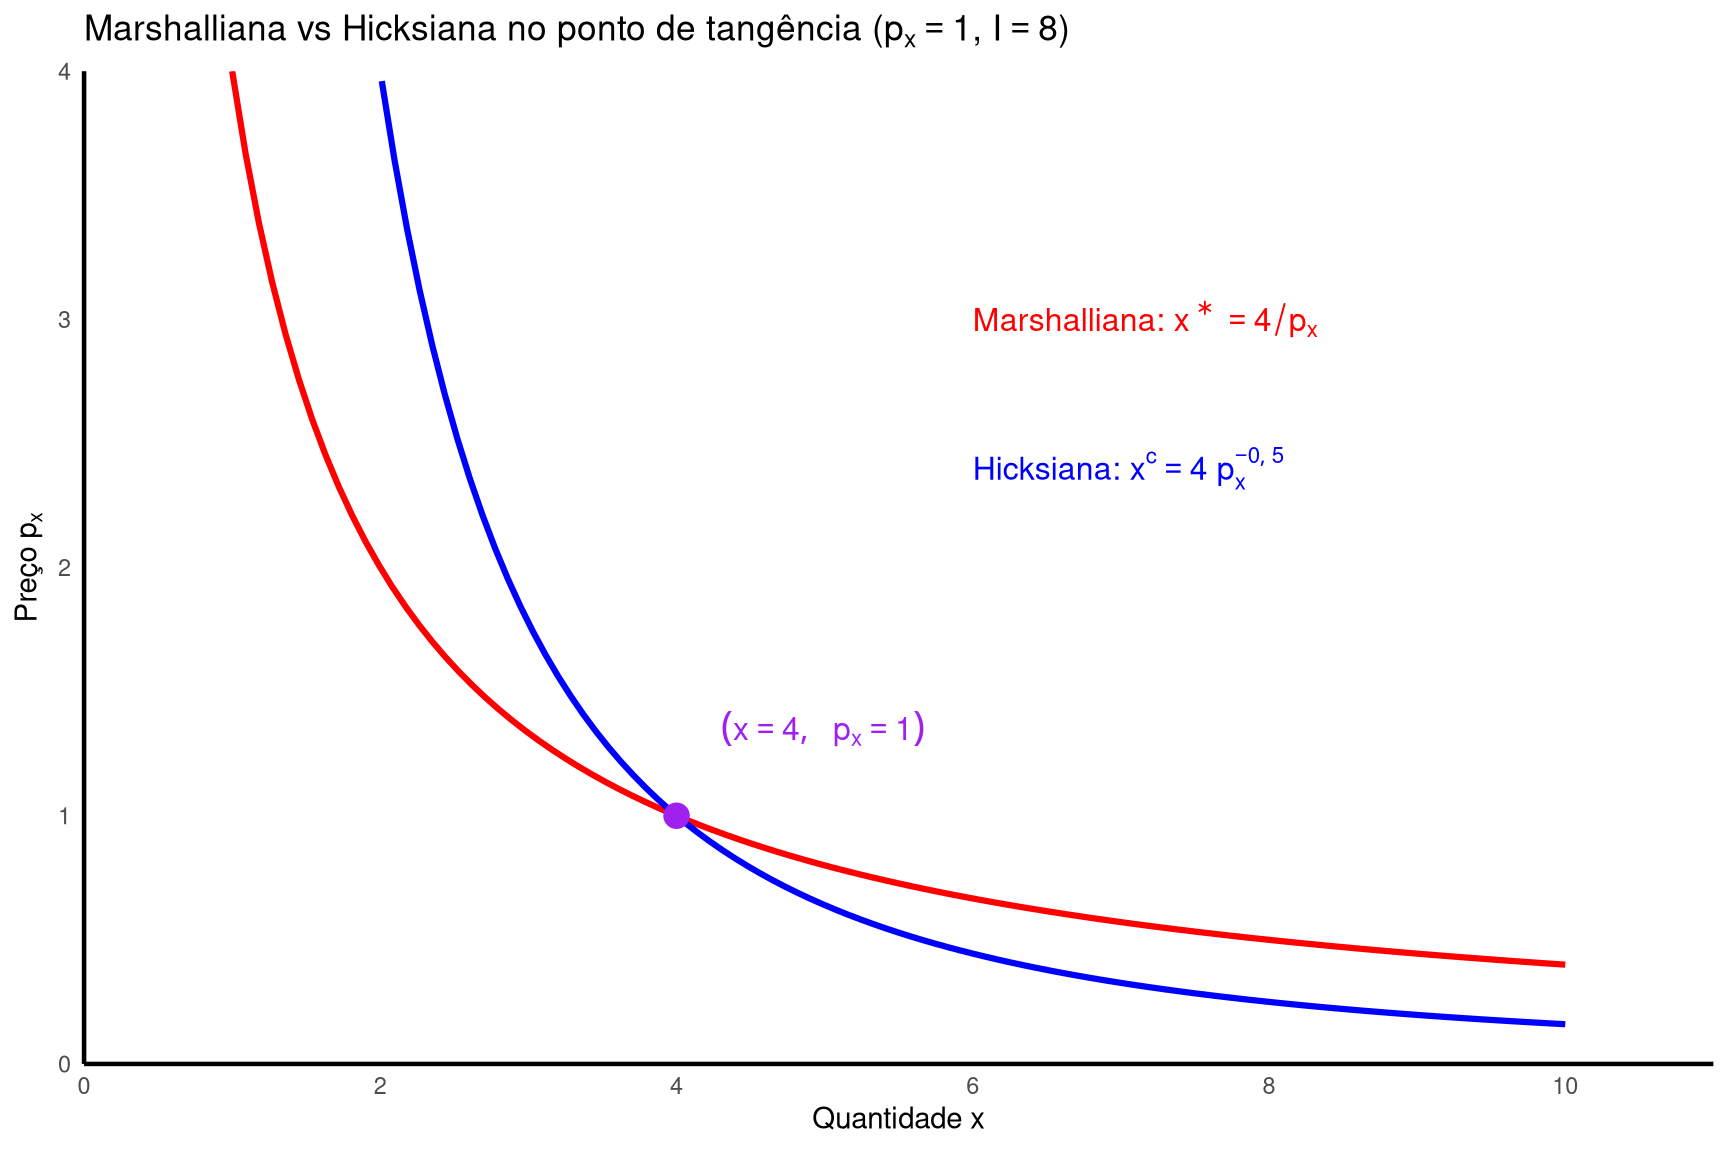
Na comparação visual com a Marshalliana (painel (b) deste callout vs. painel (b) de Note 5.4), a Hicksiana é menos responsiva a preços: entre \(p_x = 1\) e \(p_x = 4\), a Marshalliana cai de \(4\) para \(1\) enquanto a Hicksiana cai apenas de \(4\) para \(2\). As duas curvas se cruzam no ponto em que a renda \(I\) basta, aos preços vigentes, para atingir a utilidade \(\bar{U}\) de referência; no caso-base (\(I = 8\), \(p_y = 4\)), esse ponto é \((p_x, x) = (1, 4)\). A diferença vertical entre elas fora desse ponto é a magnitude do efeito renda, formalizada na equação de Slutsky (Note 5.6).
Note 5.6: Equação de Slutsky: decomposição analítica
Símbolo
Significado
\(\partial x/\partial p_x\)
efeito total (ET) — derivada da Marshalliana
\(\partial x^c/\partial p_x \big|_{U=\bar{U}}\)
efeito substituição (ES) — derivada da Hicksiana
\(x \cdot \partial x/\partial I\)
efeito renda (ER) — quantidade consumida vezes propensão marginal
O objetivo desta seção é obter uma expressão algébrica para a decomposição que fizemos graficamente em Note 5.3. Lá, separamos o deslocamento total da cesta em duas parcelas — substituição (ao longo da curva de indiferença original) e renda (entre curvas de indiferença) — por meio de uma construção geométrica baseada em deslocamentos discretos da reta orçamentária. Agora, trabalhando com variações infinitesimais de preço, a mesma decomposição emerge de uma identidade matemática envolvendo derivadas. O resultado é a equação de Slutsky, um dos teoremas centrais da teoria do consumidor (Nicholson e Snyder, 2012).
O ponto de partida é a identidade de dualidade: se a renda \(I\) for escolhida exatamente como a despesa mínima necessária para atingir a utilidade \(\bar{U}\) aos preços \((p_x, p_y)\) — ou seja, \(I = E(p_x, p_y, \bar{U})\) —, então as demandas Marshalliana e Hicksiana produzem a mesma cesta. Formalmente,
Essa identidade vale para qualquer \((p_x, p_y, U)\) e é a ponte algébrica entre os problemas primal e dual do consumidor.
Derivando ambos os lados em relação a \(p_x\) — lado esquerdo, derivada direta; lado direito, regra da cadeia porque \(E\) também depende de \(p_x\) —, obtemos
A leitura é direta: a variação total da demanda Marshalliana em resposta a uma pequena variação de \(p_x\) decompõe-se em duas parcelas — uma ao longo da curva de indiferença (ES) e outra entre curvas de indiferença (ER).
Os sinais dos dois termos são governados por propriedades distintas. O efeito substituição\(\partial x^c/\partial p_x\) é sempre não-positivo: como \(E\) é côncava em preços, sua segunda derivada é \(\leq 0\), e pelo lema de Shephard \(\partial x^c/\partial p_x = \partial^2 E/\partial p_x^2 \leq 0\) (Note 5.5). Geometricamente, isso reflete a convexidade das curvas de indiferença — ao encarecer \(x\), o consumidor sempre substitui \(x\) por \(y\) ao longo da mesma CI. Já o efeito renda\(-x \cdot \partial x/\partial I\) tem sinal determinado por \(\partial x/\partial I\): para bens normais (\(\partial x/\partial I > 0\)), o termo é negativo e reforça o ES; para bens inferiores (\(\partial x/\partial I < 0\)), o termo é positivo e atenua o ES, podendo até revertê-lo no caso extremo dos bens de Giffen (Note 5.3). Essa diferença de sinais é o que torna a Marshalliana mais responsiva a preços do que a Hicksiana no caso normal — tema da Fig. 5.7 de Nicholson e Snyder (2012) e do gráfico comparativo construído adiante.
Exercício Resolvido
Cenário: Cobb-Douglas \(U(x, y) = x^{0{,}5} y^{0{,}5}\). De Note 5.4, a demanda Marshalliana é \(x(p_x, p_y, I) = 0{,}5 I / p_x\). De Note 5.5, a demanda Hicksiana é \(x^c(p_x, p_y, U) = p_x^{-0{,}5} \, p_y^{0{,}5} \, U\). A utilidade indireta, obtida substituindo \(x\) e \(y\) ótimos em \(U\), é \(V(p_x, p_y, I) = 0{,}5 \, I \, p_x^{-0{,}5} \, p_y^{-0{,}5}\) (Example 4.1 de Nicholson e Snyder (2012)).
Passo 1 — efeito total (derivada da Marshalliana).
Como a quantidade total de \(x\) varia quando \(p_x\) muda marginalmente, considerando todos os ajustes do consumidor (substituição entre bens e mudança no poder de compra)?
\[\begin{aligned}
\frac{\partial x}{\partial p_x} &= \frac{\partial}{\partial p_x}\!\left[\frac{0{,}5 \, I}{p_x}\right] & & \text{derivando a Marshalliana em } p_x \\[6pt]
&= -\frac{0{,}5 \, I}{p_x^2} & & \text{regra da potência}
\end{aligned}\]
Sinal negativo: um aumento em \(p_x\) reduz a quantidade demandada de \(x\). Este efeito total será decomposto nos Passos 2 e 3.
Passo 2 — efeito substituição (derivada da Hicksiana).
Se o consumidor fosse compensado em renda para manter a utilidade constante, quanto de \(x\) ele substituiria por \(y\) em resposta à mudança de preço?
\[\begin{aligned}
\frac{\partial x^c}{\partial p_x} &= \frac{\partial}{\partial p_x}\!\left[p_x^{-0{,}5} \, p_y^{0{,}5} \, U\right] & & \text{derivando a Hicksiana em } p_x \\[6pt]
&= -0{,}5 \, p_x^{-1{,}5} \, p_y^{0{,}5} \, U & & \text{regra da potência}
\end{aligned}\]
A Hicksiana está em função de \(U\); para confrontá-la com a Marshalliana (que depende de \(I\)), substituímos \(U\) pela utilidade indireta \(V = 0{,}5 \, I \, p_x^{-0{,}5} \, p_y^{-0{,}5}\):
Sempre negativo: com utilidade fixa, o consumidor sempre se afasta do bem que encareceu. Captura apenas a realocação da cesta devida à mudança nos preços relativos.
Passo 3 — efeito renda.
Quanto da variação total de \(x\) se deve à perda (ou ganho) de poder de compra causada pela mudança de \(p_x\)?
\[\begin{aligned}
x \cdot \frac{\partial x}{\partial I} &= \frac{0{,}5 \, I}{p_x} \cdot \frac{\partial}{\partial I}\!\left[\frac{0{,}5 \, I}{p_x}\right] & & \text{quantidade demandada vezes propensão marginal} \\[6pt]
&= \frac{0{,}5 \, I}{p_x} \cdot \frac{0{,}5}{p_x} & & \text{derivada linear em } I \\[6pt]
&= \frac{0{,}25 \, I}{p_x^2} & & \text{multiplicando}
\end{aligned}\]
Na equação de Slutsky este termo aparece com sinal negativo (\(-x \cdot \partial x/\partial I\)):
Negativo para bens normais (\(\partial x/\partial I > 0\)): a alta de preço reduz o poder de compra, e como \(x\) é normal, o consumidor demanda menos. Reforça o efeito substituição.
Leitura: adotando a convenção ET \(=\) ES \(+\) ER (mesma de Note 5.3), absorvemos o sinal de subtração no efeito renda: ER \(= -x \cdot \partial x/\partial I = -0{,}25 \, I/p_x^2\). Com isso, ET \(= -4 = -2 + (-2) =\) ES \(+\) ER, confirmando a identidade. No ponto inicial, ES e ER contribuem com magnitudes iguais (\(-2\) cada), somando o efeito total \(-4\). Essa simetria não é coincidência: na Cobb-Douglas com expoentes iguais (\(\alpha = \beta = 0{,}5\)), metade do orçamento vai para cada bem e as duas parcelas da decomposição têm exatamente o mesmo peso. Preferências mais assimétricas produzem decomposições desbalanceadas, como se verá nos exercícios do Cap. 5 de Nicholson e Snyder (2012).
Implementação em R
Código
# Comparação entre Marshalliana e Hicksiana no plano (x, p_x).# Caso Cobb-Douglas U = sqrt(xy), com I = 8, p_y = 4, U_ref = 2.# Marshalliana: x*(p_x) = 0,5 I / p_x = 4 / p_x => p_x = 4 / x# Hicksiana: x^c(p_x) = 4 / sqrt(p_x) => p_x = 16 / x^2# Ambas passam pelo ponto comum (x, p_x) = (4, 1).ggplot() +# Curva Marshalliana (vermelho): p_x = 4 / xgeom_function(fun = \(x) 4/ x, xlim =c(1, 10),color ="red", linewidth =1.1) +# Curva Hicksiana (azul): p_x = 16 / x^2geom_function(fun = \(x) 16/ x^2, xlim =c(1.5, 10),color ="blue", linewidth =1.1) +# Ponto comum de tangênciageom_point(aes(x =4, y =1), color ="purple", size =4) +# Rótulo do ponto comumannotate("text", x =4.3, y =1.35,label = latex2exp::TeX(r"($(x=4,\ p_x=1)$)"),color ="purple", size =4.2, hjust =0) +# Rótulos posicionados no canto superior direito (região sem curvas);# a cor já identifica a qual curva cada rótulo se refere.annotate("text", x =6, y =3.0,label = latex2exp::TeX(r"(Marshalliana: $x^* = 4/p_x$)"),color ="red", size =4.2, hjust =0) +annotate("text", x =6, y =2.4,label = latex2exp::TeX(r"(Hicksiana: $x^c = 4 \, p_x^{-0{,}5}$)"),color ="blue", size =4.2, hjust =0) +scale_x_continuous(expand =c(0, 0),limits =c(0, 11),breaks =seq(0, 10, 2) ) +scale_y_continuous(expand =c(0, 0),limits =c(0, 4),breaks =seq(0, 4, 1) ) +labs(x = latex2exp::TeX(r"(Quantidade $x$)"),y = latex2exp::TeX(r"(Preço $p_x$)"),title = latex2exp::TeX(r"(Marshalliana vs Hicksiana no ponto de tangência ($p_x = 1$, $I = 8$))") ) +theme_minimal() +theme(axis.line =element_line(color ="black", linewidth =0.8),panel.grid =element_blank() )
Interpretação
A equação de Slutsky unifica duas versões da mesma decomposição. A gráfica (Note 5.3) compara antes e depois de um choque finito de preço; a analítica responde como a demanda varia em resposta a uma variação infinitesimal. Em ambas, o efeito total é soma de substituição (utilidade constante) e renda (poder de compra variando). O resultado mais robusto é o sinal não-positivo do efeito substituição: como a função de despesa é côncava em preços (Note 5.5), \(\partial x^c/\partial p_x \leq 0\) vale para qualquer estrutura de preferências que respeite os axiomas básicos. Daí a importância da Hicksiana em bem-estar: seu sinal é previsível por construção.
O efeito renda, diferentemente, depende do tipo de bem. Para bens normais, \(\partial x/\partial I > 0\) torna o ER negativo, reforçando o ES; a Marshalliana fica mais responsiva a preços que a Hicksiana. Para bens inferiores, o ER tem sinal oposto ao ES e o atenua; no caso Giffen, o domina, invertendo a inclinação da Marshalliana. No gráfico, as duas curvas se cruzam em \((x, p_x) = (4, 1)\), o ponto-base em que \(I = 8\) permite atingir \(\bar{U} = 2\). A diferença vertical entre elas, em cada \(p_x\), é a magnitude acumulada do efeito renda.
Aplicações de Slutsky incluem variação compensatória e equivalente (análise de bem-estar), elasticidades compensadas (tributação e deadweight loss, Cap. 6 de Nicholson e Snyder (2012)) e as restrições de simetria e negatividade impostas a sistemas de demanda estimados empiricamente. Com essa formalização, o capítulo fecha seu arco: homogeneidade, variações de renda, decomposição gráfica, as curvas Marshalliana e Hicksiana, e agora Slutsky. O próximo passo é o estudo de elasticidades, agregação de demandas e análise aplicada de bem-estar.
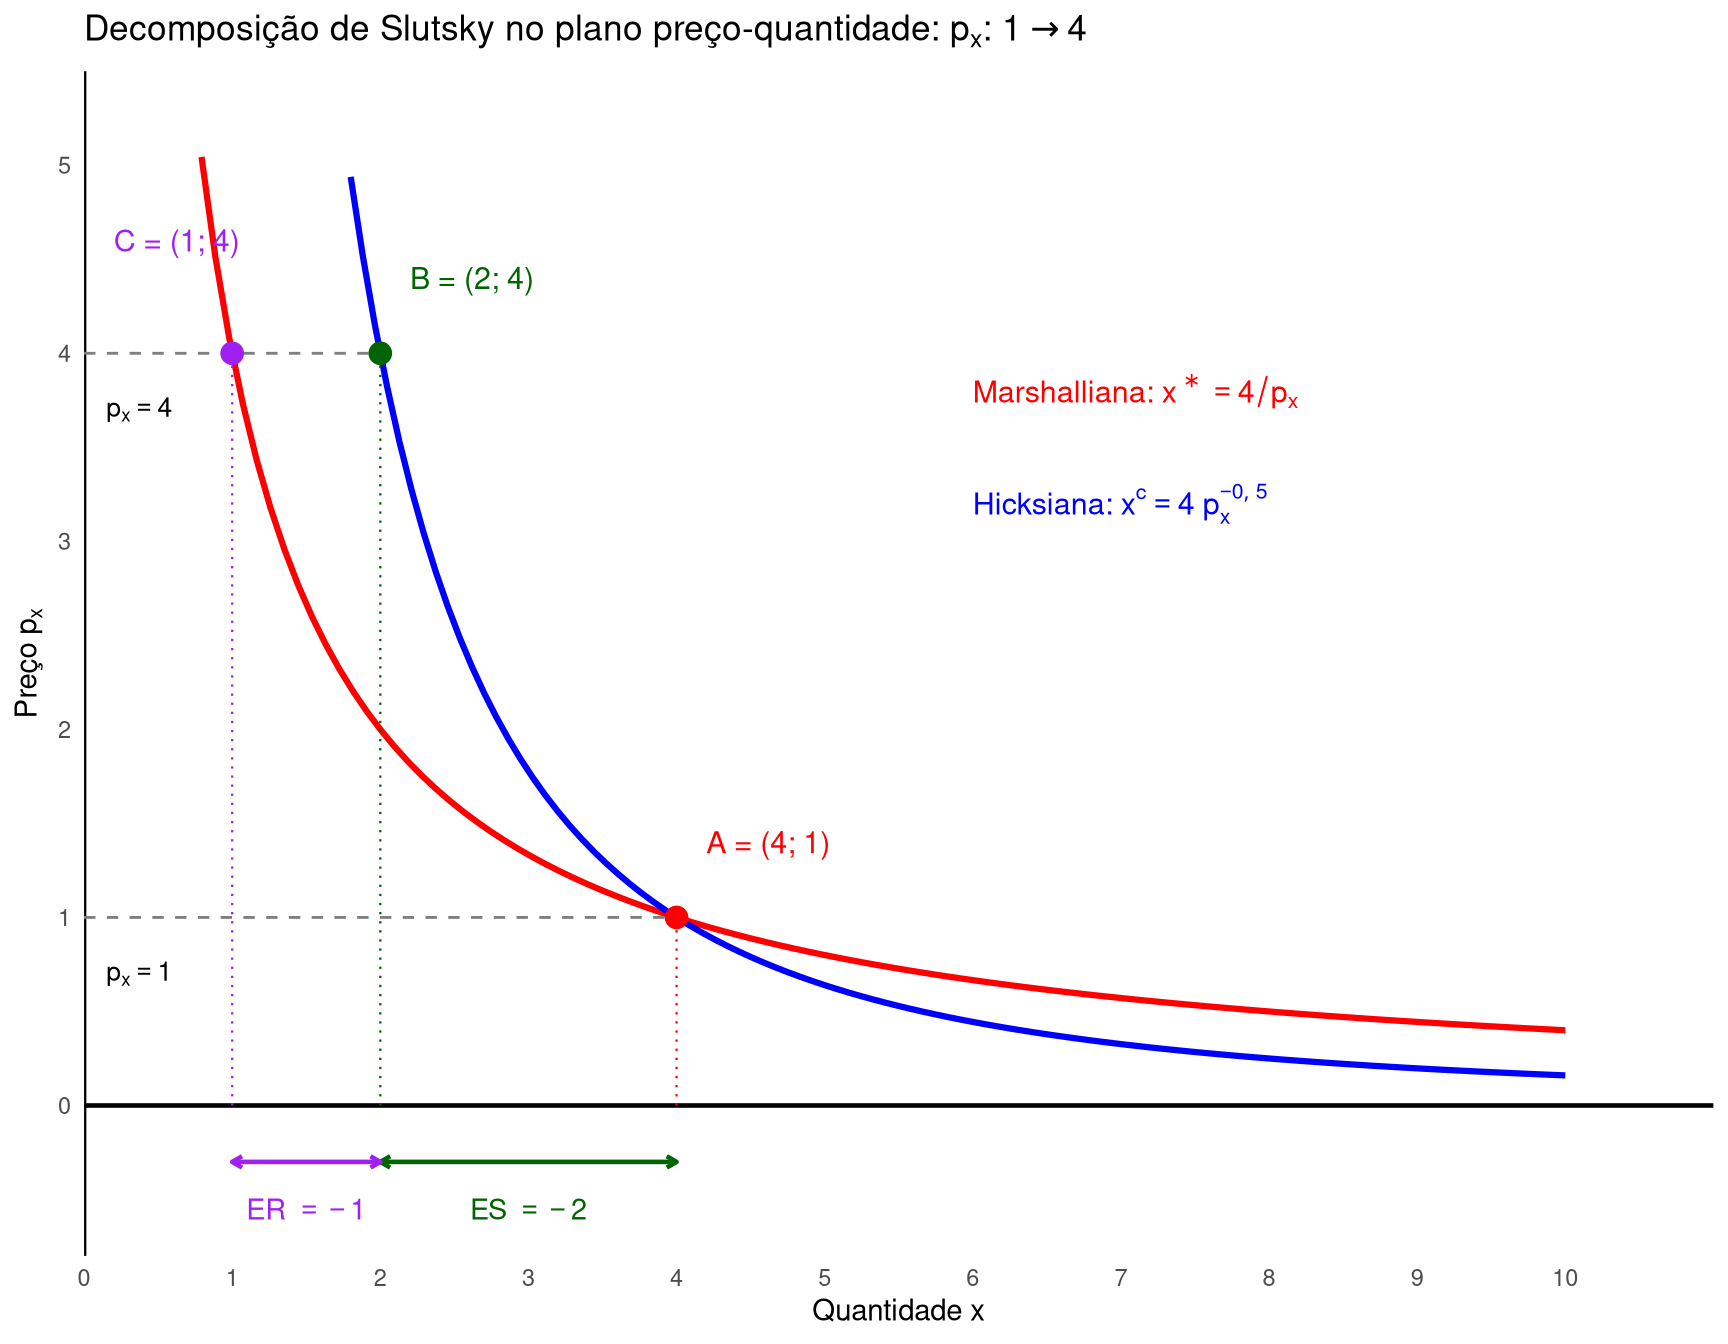
Decomposição gráfica via curvas de demanda
O gráfico abaixo replica a decomposição de Note 5.3 (que usava o plano \(x \times y\)), agora no plano preço-quantidade (\(x \times p_x\)) usando as curvas de demanda Marshalliana e Hicksiana. Para o choque \(p_x: 1 \to 4\):
\(A = (4;\; 1)\): ponto inicial, onde ambas as curvas se cruzam (ao preço antigo, Marshalliana e Hicksiana coincidem).
\(B = (2;\; 4)\): ponto sobre a Hicksiana ao preço novo. O consumidor, se compensado para manter \(\bar{U} = 2\), demandaria \(x^c = 4/\sqrt{4} = 2\). O movimento \(A \to B\) é o efeito substituição (ES \(= 2 - 4 = -2\)).
\(C = (1;\; 4)\): ponto sobre a Marshalliana ao preço novo. Sem compensação, demanda \(x^* = 4/4 = 1\). O movimento \(B \to C\) é o efeito renda (ER \(= 1 - 2 = -1\)).
Efeito total: \(A \to C\), ET \(= 1 - 4 = -3 =\) ES \(+\) ER ✓.
Os mesmos valores de Note 5.3 (\(-2\), \(-1\), \(-3\)), agora lidos diretamente nas curvas de demanda: a distância horizontal entre \(A\) e \(B\) é o ES; entre \(B\) e \(C\), o ER; entre \(A\) e \(C\), o ET.
Código
# Decomposição de Slutsky no plano preço-quantidade.# Marshalliana: x* = 4/p_x => p_x = 4/x# Hicksiana: x^c = 4/sqrt(p_x) => p_x = 16/x^2# Choque: p_x de 1 para 4.# A = (4, 1): ambas curvas em p_x = 1# B = (2, 4): Hicksiana em p_x = 4# C = (1, 4): Marshalliana em p_x = 4ggplot() +# Eixos em x = 0 e y = 0geom_hline(yintercept =0, color ="black", linewidth =0.8) +geom_vline(xintercept =0, color ="black", linewidth =0.8) +# Curva Marshalliana (vermelho): p_x = 4/xgeom_function(fun = \(x) 4/ x, xlim =c(0.7, 10),color ="red", linewidth =1.1) +# Curva Hicksiana (azul): p_x = 16/x^2geom_function(fun = \(x) 16/ x^2, xlim =c(1.8, 10),color ="blue", linewidth =1.1) +# Linhas horizontais tracejadas nos preços antigo e novogeom_segment(aes(x =0, y =1, xend =4, yend =1),linetype ="dashed", color ="gray50", linewidth =0.5) +geom_segment(aes(x =0, y =4, xend =2, yend =4),linetype ="dashed", color ="gray50", linewidth =0.5) +# Projeções verticais dos 3 pontos até o eixo xgeom_segment(aes(x =4, y =0, xend =4, yend =1),linetype ="dotted", color ="red", linewidth =0.4) +geom_segment(aes(x =2, y =0, xend =2, yend =4),linetype ="dotted", color ="darkgreen", linewidth =0.4) +geom_segment(aes(x =1, y =0, xend =1, yend =4),linetype ="dotted", color ="purple", linewidth =0.4) +# Pontos A, B, Cgeom_point(aes(x =4, y =1), color ="red", size =3.5) +geom_point(aes(x =2, y =4), color ="darkgreen", size =3.5) +geom_point(aes(x =1, y =4), color ="purple", size =3.5) +# Rótulos dos pontosannotate("text", x =4.2, y =1.4,label ="A = (4; 1)", color ="red", size =4, hjust =0) +annotate("text", x =2.2, y =4.4,label ="B = (2; 4)", color ="darkgreen", size =4, hjust =0) +annotate("text", x =0.2, y =4.6,label ="C = (1; 4)", color ="purple", size =4, hjust =0) +# Rótulos de preço no eixo yannotate("text", x =0.15, y =0.7,label = latex2exp::TeX(r"($p_x = 1$)"),size =3.5, hjust =0) +annotate("text", x =0.15, y =3.7,label = latex2exp::TeX(r"($p_x = 4$)"),size =3.5, hjust =0) +# Colchetes ES e ER abaixo do eixo xannotate("segment", x =2, xend =4, y =-0.30, yend =-0.30,color ="darkgreen", linewidth =0.8,arrow =arrow(ends ="both", length =unit(0.15, "cm"))) +annotate("text", x =3, y =-0.55,label = latex2exp::TeX(r"(ES $= -2$)"),color ="darkgreen", size =3.8) +annotate("segment", x =1, xend =2, y =-0.30, yend =-0.30,color ="purple", linewidth =0.8,arrow =arrow(ends ="both", length =unit(0.15, "cm"))) +annotate("text", x =1.5, y =-0.55,label = latex2exp::TeX(r"(ER $= -1$)"),color ="purple", size =3.8) +# Rótulos das curvas (canto superior direito, sem sobreposição)annotate("text", x =6, y =3.8,label = latex2exp::TeX(r"(Marshalliana: $x^* = 4/p_x$)"),color ="red", size =4, hjust =0) +annotate("text", x =6, y =3.2,label = latex2exp::TeX(r"(Hicksiana: $x^c = 4 \, p_x^{-0{,}5}$)"),color ="blue", size =4, hjust =0) +scale_x_continuous(expand =c(0, 0),limits =c(0, 11),breaks =seq(0, 10, 1) ) +scale_y_continuous(expand =c(0, 0),limits =c(-0.8, 5.5),breaks =seq(0, 5, 1) ) +labs(x = latex2exp::TeX(r"(Quantidade $x$)"),y = latex2exp::TeX(r"(Preço $p_x$)"),title = latex2exp::TeX(r"(Decomposição de Slutsky no plano preço-quantidade: $p_x$: $1 \to 4$)") ) +theme_minimal() +theme(axis.line =element_blank(),panel.grid =element_blank() )
Note 5.7: Elasticidades da demanda
Símbolo
Significado
\(e_{x, p_x}\)
elasticidade-preço da demanda
\(e_{x, I}\)
elasticidade-renda
\(e_{x, p_y}\)
elasticidade-preço cruzada
\(e_{x^c, p_x}\)
elasticidade-preço compensada (Hicksiana)
\(s_x = p_x x / I\)
fração da renda gasta em \(x\)
Desenvolvimento Teórico
As derivadas \(\partial x/\partial p_x\), \(\partial x/\partial I\) e \(\partial x/\partial p_y\) que estudamos nos callouts anteriores dependem das unidades em que preços, renda e quantidades são medidos. Por isso, no trabalho empírico, prefere-se trabalhar com elasticidades: medidas adimensionais que expressam variações proporcionais (percentuais) e permitem comparação entre bens, países e períodos (Nicholson e Snyder, 2012).
Definições (Marshalliana). A partir da função de demanda \(x(p_x, p_y, I)\):
Classificação da elasticidade-preço. Como a demanda Marshalliana de bens normais e inferiores comuns é descendente, \(e_{x, p_x} \leq 0\). Pela magnitude absoluta, convencionou-se:
Caso
Valor de \(e_{x, p_x}\)
Interpretação
Elástica
\(e_{x, p_x} < -1\)
demanda responde mais que proporcionalmente a \(p_x\)
Elasticidade-preço e gasto total. O gasto em \(x\) é o produto \(p_x \cdot x\). Diferenciando em relação a \(p_x\) pela regra do produto:
\[\begin{aligned}
\frac{\partial (p_x \cdot x)}{\partial p_x} &= \frac{\partial p_x}{\partial p_x} \cdot x + p_x \cdot \frac{\partial x}{\partial p_x} & & \text{regra do produto} \\[6pt]
&= x + p_x \cdot \frac{\partial x}{\partial p_x} & & \text{pois } \partial p_x/\partial p_x = 1 \\[6pt]
&= x + x \cdot \frac{\partial x}{\partial p_x} \cdot \frac{p_x}{x} & & \text{multiplicando e dividindo por } x \\[6pt]
&= x + x \cdot e_{x, p_x} & & \text{definição de } e_{x, p_x} \\[6pt]
&= x \, (1 + e_{x, p_x}) & & \text{colocando } x \text{ em evidência}
\end{aligned}\]
O sinal depende de \(e_{x, p_x}\) ser maior ou menor que \(-1\): demanda inelástica (\(-1 < e_{x, p_x} < 0\)) implica \(1 + e_{x, p_x} > 0\) e o gasto total cresce com o preço; demanda elástica (\(e_{x, p_x} < -1\)) implica \(1 + e_{x, p_x} < 0\) e o gasto cai; no caso unitário (\(e_{x, p_x} = -1\)), o gasto é invariante a \(p_x\).
Elasticidades compensadas. Aplicando as mesmas definições à demanda Hicksiana \(x^c(p_x, p_y, U)\):
A elasticidade Marshalliana e a compensada coincidem quando o bem tem pequena participação no orçamento (\(s_x \to 0\)) ou quando a demanda é renda-inelástica (\(e_{x, I} \to 0\)). Em muitos bens aplicados, ao menos uma dessas condições se aproxima, de modo que os dois conceitos de elasticidade-preço podem ser usados quase indistintamente no trabalho empírico (Nicholson e Snyder, 2012).
Três relações de agregação
Da estrutura de utilidade-maximização (restrição orçamentária + homogeneidade da demanda) seguem três restrições internas entre as elasticidades. Derivamos cada uma abaixo.
(i) Homogeneidade de grau zero — via teorema de Euler.
A demanda Marshalliana \(x(p_x, p_y, I)\) é homogênea de grau zero em \((p_x, p_y, I)\), como mostrado em Note 5.1. Pelo teorema de Euler, se uma função \(f(z_1, \ldots, z_n)\) é homogênea de grau \(k\), então \(\sum_i z_i \, \partial f/\partial z_i = k \cdot f\). Aplicado a \(x\) com \(k = 0\):
Ou seja, a soma das três elasticidades é zero: não é possível que todas sejam positivas (ou todas negativas) — a estrutura de utilidade-maximização força um balanço entre elas.
(ii) Agregação de Engel — via derivação da restrição orçamentária em \(I\).
A restrição orçamentária é \(I = p_x x + p_y y\). Derivando ambos os lados em relação a \(I\) (com \(p_x, p_y\) fixos):
A média ponderada das elasticidades-renda (com pesos iguais às frações de gasto) é exatamente \(1\). Se um bem tem elasticidade-renda menor que \(1\) (caso da alimentação na Lei de Engel, Note 5.2), algum outro bem do orçamento necessariamente tem elasticidade-renda maior que \(1\) (bem de luxo).
(iii) Agregação de Cournot — via derivação da restrição orçamentária em \(p_x\).
Novamente partindo de \(I = p_x x + p_y y\) e derivando agora em relação a \(p_x\) (com \(p_y, I\) fixos, e lembrando que \(x\) e \(y\) são funções de \(p_x\)):
A restrição orçamentária impõe que efeitos próprios e cruzados das mudanças de preço estejam conectados: um choque em \(p_x\) não pode afetar apenas o consumo de \(x\); necessariamente altera também o consumo de \(y\) na proporção ditada por esta equação.
Essas três restrições — homogeneidade, Engel e Cournot — não dependem da forma funcional da utilidade. Qualquer sistema de demanda derivado de utilidade-maximização deve satisfazê-las, e testes empíricos dessas relações são usados para avaliar a consistência teórica de estimativas de elasticidades.
Exercício Resolvido
Cenário: Cobb-Douglas \(U = x^\alpha y^{1-\alpha}\) com \(\alpha + \beta = 1\). As demandas Marshallianas são \(x^* = \alpha I / p_x\) e \(y^* = (1-\alpha) I / p_y\). Vamos calcular as três elasticidades de \(x\), verificar as relações de agregação e obter a elasticidade compensada via Slutsky.
Passo 1 — Elasticidade-preço \(e_{x, p_x}\).
Começamos calculando a derivada parcial. Reescrevemos \(x = \alpha I \cdot p_x^{-1}\) para aplicar a regra da potência:
\[\begin{aligned}
\frac{\partial x}{\partial p_x} &= \frac{\partial}{\partial p_x}\!\left[\alpha I \cdot p_x^{-1}\right] & & \text{reescrevendo } x \\[6pt]
&= \alpha I \cdot (-1) \cdot p_x^{-2} & & \text{regra da potência, } \alpha I \text{ constante em } p_x \\[6pt]
&= -\frac{\alpha I}{p_x^2}
\end{aligned}\]
Verificação numérica em dois cenários. Comparamos o fio-condutor (\(\alpha = \beta = 0{,}5\)) com um caso alternativo assimétrico (\(\alpha = 0{,}3\), \(\beta = 0{,}7\)). A renda e os preços são os mesmos: \(p_x = 1\), \(p_y = 4\), \(I = 8\).
As três elasticidades Marshallianas são constantes em \(\alpha\) — característica peculiar da Cobb-Douglas. Diferentes expoentes geram diferentes cestas ótimas, mas as proporções de resposta da demanda a \(p_x\), \(I\) e \(p_y\) permanecem \(-1\), \(1\) e \(0\).
A fração de gasto coincide com o expoente (\(s_x = \alpha\)): expoente maior, bem mais importante no orçamento.
A Hicksiana fica mais próxima da Marshalliana quando o bem tem menor peso no orçamento. No cenário \(\alpha = 0{,}3\), \(|e_{x^c, p_x}| = 0{,}7\) está a apenas \(0{,}3\) da Marshalliana; no cenário \(\alpha = 0{,}5\), a distância é \(0{,}5\). Isso ilustra concretamente a observação de que Marshalliana e Hicksiana convergem quando \(s_x \to 0\).
Para um cenário extremo (\(\alpha \to 0\), bem com participação desprezível no orçamento), teríamos \(e_{x^c, p_x} \to -1 = e_{x, p_x}\) — as duas elasticidades coincidem.
Interpretação
Elasticidades são o padrão empírico para descrever respostas da demanda porque são adimensionais: comparáveis entre bens, mercados e períodos. A Marshalliana fornece as elasticidades observáveis; a Hicksiana fornece a contraparte teoricamente limpa, depurada do efeito renda via Slutsky em forma de elasticidade.
A Cobb-Douglas produz elasticidades constantes (\(-1\), \(1\), \(0\)), caso especial em que a receita total é invariante ao preço. Formas mais flexíveis (CES, Stone-Geary, AIDS) permitem elasticidades variáveis ao longo da curva de demanda, capturando regularidades empíricas como a Lei de Engel (Note 5.2). As três relações de agregação (homogeneidade, Engel, Cournot) funcionam como testes de consistência: qualquer sistema de demanda estimado que as viole está em conflito com a hipótese de maximização racional do consumidor.
Referências
NICHOLSON, W.; SNYDER, C. Microeconomic Theory: Basic Principles and Extensions. 11. ed. [s.l.] South-Western, Cengage Learning, 2012.